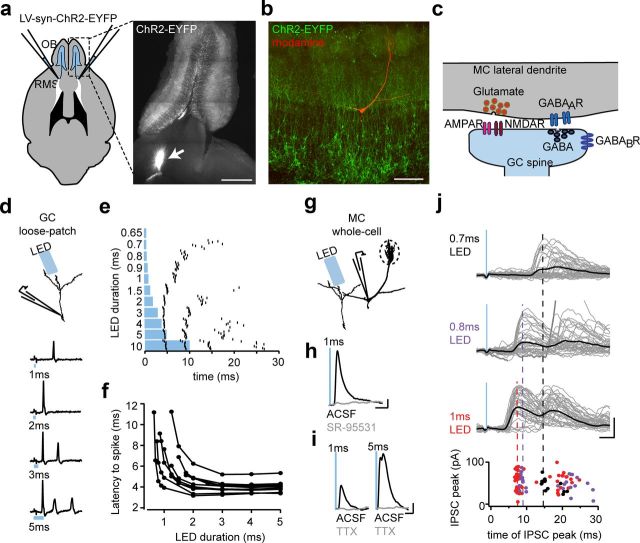
Figure 1.
ChR2 evokes synchronous GABA release from adult-born GCs. a, A ChR2 lentivirus injected into the RMS infects immature GC neuroblasts migrating toward the OB. Right inset, Horizontal slice of the OB 4 weeks after injection showing the injection site (arrow) distal to the OB. Scale bar, 1 mm. b, Confocal stack of reconstructed MC (red) and ChR2+ GCs (green). Scale bar, 100 μm. c, Schematic of the dendrodendritic synapse between MCs and GCs showing the putative location of GABABRs. d, e, Example traces (d) and example raster plot (e) of spikes recorded in a loose-patch configuration at different stimulation durations using an LED (10 trials per duration, left). f, Relationship between the latency to first spike and the LED duration (mean threshold to spike, 1.5 ± 0.2 ms; mean minimum latency to spike, 4.1 ± 0.3 ms; n = 9 cells). g, Schematic of setup to measure postsynaptic currents in an MC. h, i, Average MC IPSCs from 8 weeks after injection for ChR2+ GCs (injected at P60) before (black) and after (gray) administration of GABAA antagonist SR-95531 [6-Imino-3-(4-methoxyphenyl)-1(6H)-pyridazinebutanoic acid hydrobromide] (10 μm; calibration: 10 pA, 10 ms) (h) and Na-channel antagonist TTX (1 μm) at short (1 ms) and long (5 ms) stimulation durations (calibration: 10 pA, 20 ms) (i). j, Example individual IPSCs (gray lines) and average IPSCs (black line) recorded from an MC at different LED stimulation durations (top; calibration: 40 pA, 5 ms). With increasing LED duration, the aligned peak times of each IPSC (bottom) exhibited latency precession similar to what we observed with GC spikes.

