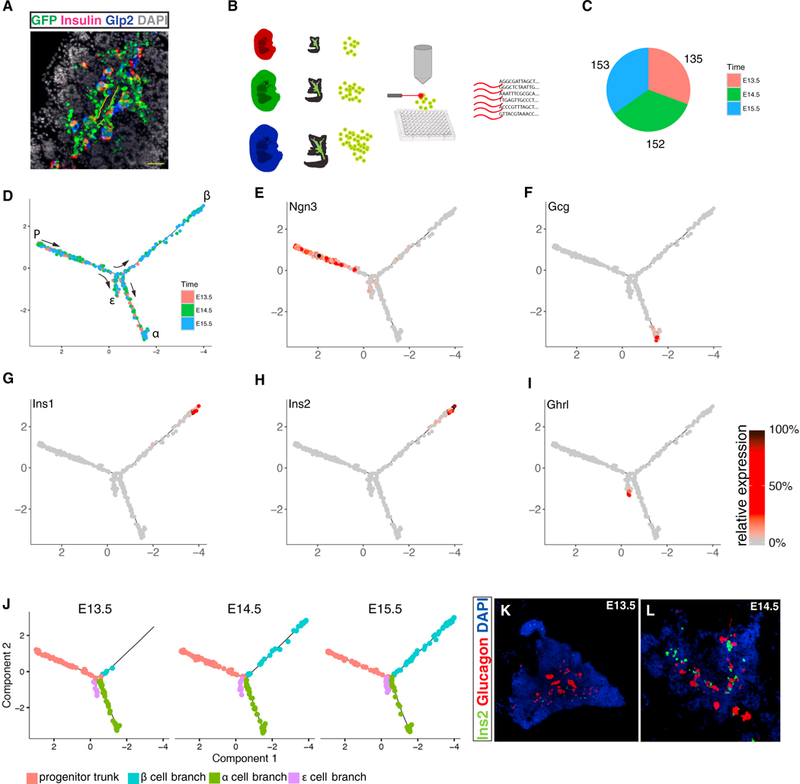
Figure 1. Mapping Pancreatic Islet Formation Using Single-Cell RNA Sequencing.

(A) Immunostaining of a cross section through E15.5 pancreas from a Ngn3-eGFP+/− embryo. Notice that eGFP first appears where Ngn3+ cells emerge, at the periphery of the epithelial cords (outlined with yellow dashed line), and persists long enough to be co-expressed with Insulin or Glucagon (detected by an antibody to its processing byproduct, Glp2).
(B) Experimental outline: a pancreas from a single Ngn3-eGFP+/− mouse embryo was removed on E13.5 (red), E14.5 (green), and E15.5 (blue) days post-coitum. Single eGFP+ cells were sorted into 96-well plates, and single-cell cDNA libraries were generated.
(C) Altogether, 440 single cells were suitable for further analysis. Colors represent the developmental day of cell collection.
(D) Monocle arranged the sequenced cells into a tree-shaped branched trajectory. Colors represent the developmental day of cell collection.
(E–I) Each cell is colored according to its relative expression level of the indicated gene: (E) Ngn3, (F) Gcg, (G) Ins1, (H) Ins2, and (I) Ghrl.
(J) Skeletons of the developmental tree dressed only with the cells collected on a given day. Notice the absence of insulin-expressing cells at E13.5.
(K and L) In situ hybridization of sections through embryonic pancreata at E13.5 (K) and E14.5 (L) shows that Ins+ cells start becoming abundant at E14.5. Tiling of multiple high-resolution images.
