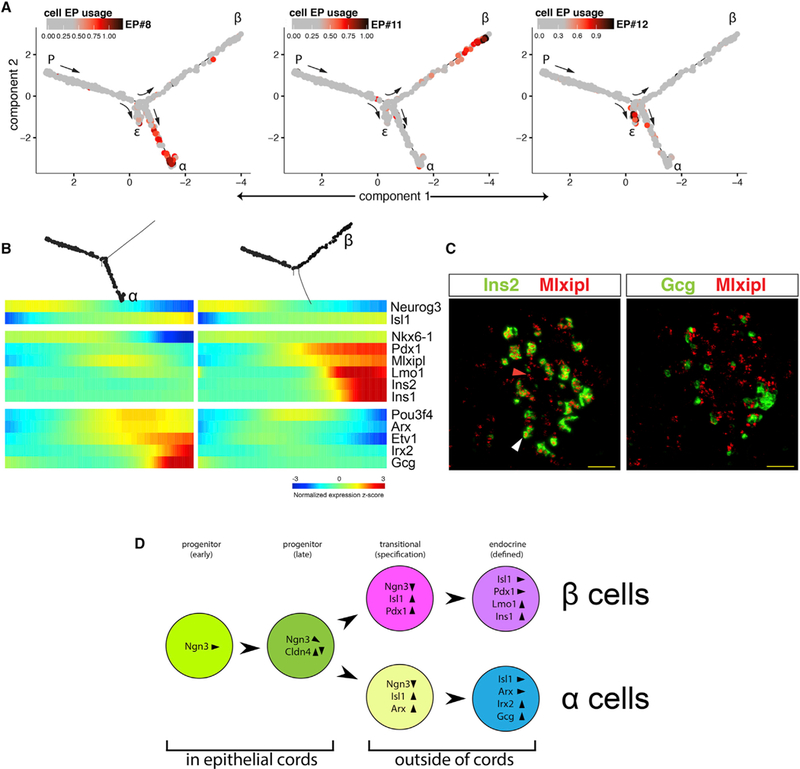
Figure 4. Analysis of Branch-Specific EPs Reveals Sequential Gene Activation during Endocrine Cell Specification.

(A) Each cell in the developmental trajectory is colored according to the EP usage value for a given cell-type-specific EP.
(B) Pseudotemporal heatmaps of select α cell (left) and β cell (right) branch-specific genes. Notice the additive activation of factors with time.
(C) In situ hybridization of E15.5 embryonic pancreas. Mlxipl transcripts are detected in Ins2+ β cells (white arrowhead) and in cells that are still Ins2− (red arrowhead). Mlxipl is not expressed in Gcg+ cells. Scale bar, 50 μm.
(D) Stepwise endocrine differentiation. Early progenitors express high levels of Ngn3. While still embedded in the epithelial cords, Ngn3 expression declines, and Cldn4 is expressed transiently. As Ngn3 is downregulated, the pan-endocrine marker Isl1 is upregulated. Concurrently, lineage-specific patterns emerge, the cells leave the epithelial cord, and Cldn4 is downregulated. In the α cell lineage Arx is upregulated, whereas in β cells Pdx1 expression is dramatically increased. Finally, the cell-specific hormones appear together with additional lineage-specific transcription factors. See also Figure S2C.
