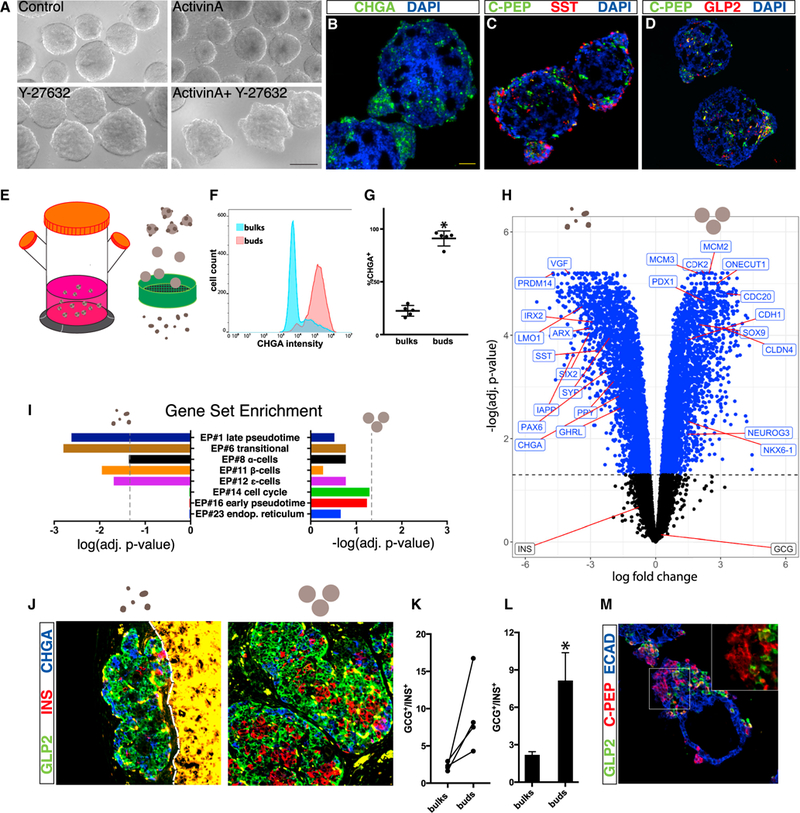
Figure 7. Induction of Human Peninsula-like Structures In Vitro by Directed Differentiation of Human Embryonic Stem Cells.

(A) HUES8 cells differentiated to pancreatic progenitors form smooth spheroids at stage 4, when the first endocrine cells appear. ActivinA alone induces cell shedding. ActivinA together with Y-27632 induces buds. Scale bar, 200 μm.
(B–D) Immunofluorescence staining of cross-sections through clusters derived from the directed differentiation of hESCs into β-like cells (SC-β): (B) CHGA,
(C) C-PEP (byproduct of insulin processing) and SST, and (D) C-PEP and GLP2.
(E) SC-β clusters at early stage 5 were mechanically agitated to break the buds off. Buds and bulks were size separated using sieves.
(F and G) Flow cytometry analysis on bulks and buds immediately after mechanical separation.
(F) Representative distribution of CHGA intensity in cells dissociated from either bulks or buds.
(G) Relative abundance of CHGA+ cells in bulks and buds. P = 4.97e−5, n = 5, Student’s t test.
(H) RNA-seq comparison of isolated buds and bulks (n = 3 and n = 5, respectively, from five separate differentiation batches). Significantly differentially expressed genes are colored in blue (adjusted p < 0.05). Genes enriched in buds are to the left, genes enriched in bulks are to the right.
(I) Gene set enrichment analysis on the differentially expressed genes was performed using gene sets defined based on the top 100 genes of each EP. Significance of enrichment in buds and bulks is illustrated to the left and right, respectively. Dashed lines, adjusted p = 0.05. False discovery rate (FDR) < 10%.
(J–L) Continued differentiation of isolated cluster compartments after transplantation to the kidney capsule of immunodeficient mice.
(J) Immunofluorescent staining of a section through a kidney transplanted with bulks (right) or buds (left) grown in culture priorto transplantation. A dashed line marks the boundary between the kidney and the transplant (kidney appears yellow because of autofluorescence).
(K and L) Quantification of the ratios between GCG+ α-like cells and INS+ β-like cells in grafts.
(K) Buds and bulks from the same in vitro batch are matched.
(L) Summary of transplantations (geometric mean ± SE). p = 0.028, n = 4, Student’s t test on the log of GCG/INS ratios.
(M) Immunofluorescent staining of a cross-section through a bulk grown in Matrigel. Notice a bud containing multiple monohormonal INS+ (C-PEP+) cells. Inset: INS+ cells are arranged densely, as in normal islets. See also Figure S6 and Video S7.
