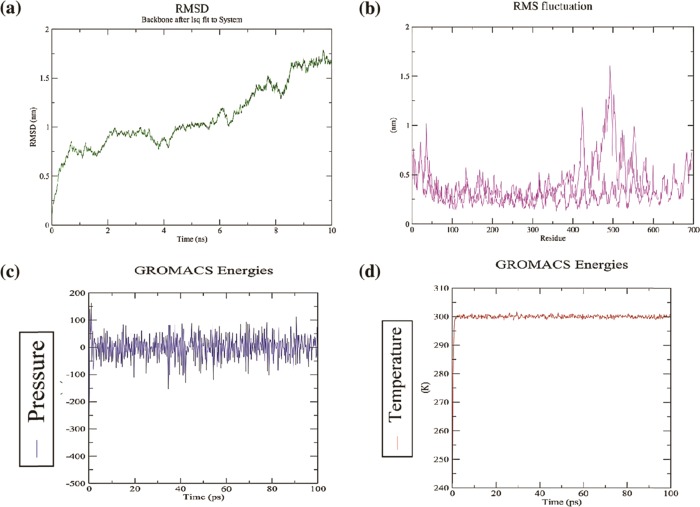
Figure 7.
(a)–(d)Molecular dynamics simulation. The plots representing the interaction and stability of the atoms and molecules between receptor (TLR-3) and ligand (vaccine candidate); plot (a) root mean square deviation (RMSD) of the receptor–ligand complex shows infinitesimal deviation and becomes stable at the period of 6 ns, which concludes the steady nature of the complex. (b) Root mean square fluctuation plot (RMSF) representing the fluctuation of side chain residues. (c)–(d) Pressure and temperature plots concerning time.

