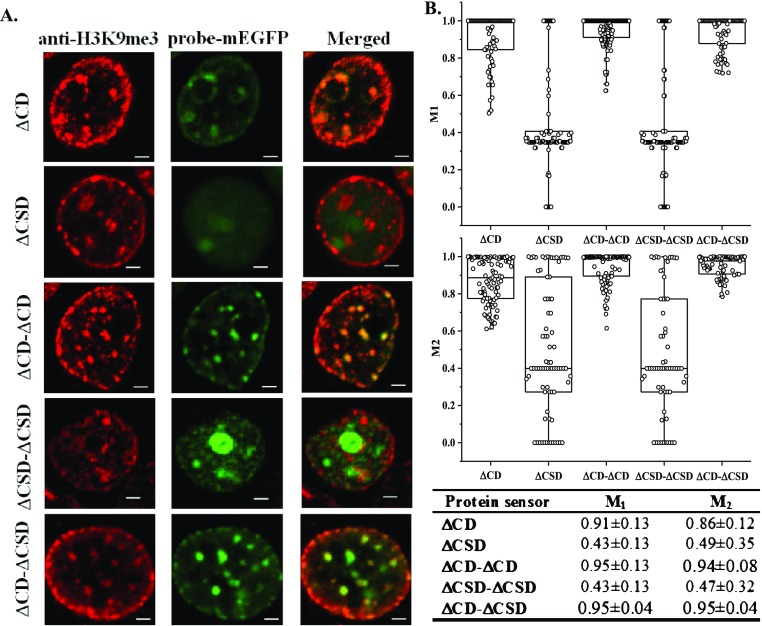
Figure 2.
(A) HEK293T cells transfected with various protein sensors and co-stained with anti-H3K9me3 antibody (Alexa 564 as secondary). Scale bar = 2 μm. All images are 2D slides of cells. (B) Mander’s correlation analysis was performed between sensor and antibody-stained images. Coefficients of colocalization, namely M1 and M2, were reported in a scattered bar plot and summarized in the table underneath, n = 100.

