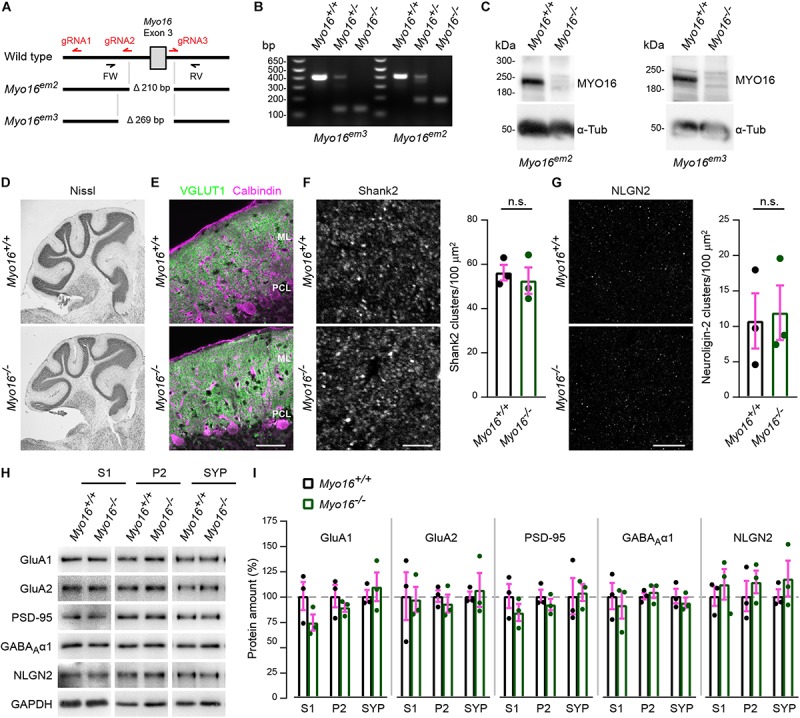
FIGURE 1.

Generation and initial characterization of Myo16 knockout mice. (A) Overview of CRISPR/Cas9-mediated creation of Myo16 knockout mice (see section “Materials and Methods” for details). Guide RNA sequences are indicated in red (gRNA1-3). Mouse lines carrying deletions of 210 bp (Myo16em2) and 269 bp (Myo16em3) were obtained, with both deletions comprising exon 3 of Myo16. Genotyping primers indicated (FW, RV). (B) Identification of mice that are hetero- or homozygous carriers of the Myo16em3 and Myo16em2 alleles via PCR genotyping using FW and RV primers. Shown is an agarose gel on which the obtained DNA fragments were separated. (C) Absence of MYO16 protein in cerebellum extracts of homozygous Myo16em2 and Myo16em3 mice. Western blot analysis was performed using cerebellar extracts from 11 day old wild-type (Myo16+/+) and homozygous knockout (Myo16–/–) mice. Antibodies against MYO16 (pre-adsorbed as described in section “Materials and Methods”) and α-Tubulin (α-Tub; loading control) were used. (D) Nissl staining of sagittal cerebellar sections from adult wild-type (Myo16+/+) and Myo16em3 knockout (Myo16–/–) mice. (E) Sagittal cerebellar sections from adult wild-type (Myo16+/+) and Myo16em3 knockout (Myo16–/–) mice immuno-fluorescently labeled with antibodies against VGLUT1 (PF terminal marker) and Calbindin-D-28K (Purkinje cell marker). ML, molecular layer; PCL, Purkinje cell layer. Scale bar, 50 μm. (F) Sagittal sections of the cerebellar molecular layer from adult Myo16+/+ and Myo16em3 knockout mice (Myo16–/–) were immuno-fluorescently labeled with antibodies against Shank2. Graph depicts number of Shank2 clusters per 100 μm2 as mean ± SEM (magenta), n = 3 (single data points represent mice analyzed), no significant differences detected (n.s.; Student’s t-test; see section “Materials and Methods”). Scale bar, 5 μm. (G) Sagittal sections of the cerebellar molecular layer from adult Myo16+/+ and Myo16em3 knockout mice (Myo16–/–) were immuno-fluorescently labeled with antibodies against neuroligin-2 (NLGN2). Graph depicts number of NLGN2 clusters per 100 μm2 as mean ± SEM (magenta), n = 3 (single data points represent mice analyzed), no significant differences detected (n.s.; Student’s t-test). Scale bar, 20 μm. (H,I) Cerebellar extracts of 25 week old Myo16+/+ and Myo16em3 knockout mice (Myo16–/–) were subjected to subcellular fractionation. S1, P2, and SYP fractions were analyzed by Western blot using the indicated antibodies. In (I), quantification of the indicated proteins from Western blots of S1, P2, and SYP fractions of Myo16+/+ and Myo16–/– mice is shown. Graphs depict protein amount after normalization to GAPDH loading control, as percentage of the mean protein amount in the respective Myo16+/+ fraction. Bars represent mean values (n = 3; data points represent mice analyzed) ± SEM (magenta), no significant differences were detected when comparing protein amounts between the same fraction (S1, P2, or SYP) of Myo16+/+ and Myo16–/– mice (n.s.; Student’s t-test).
