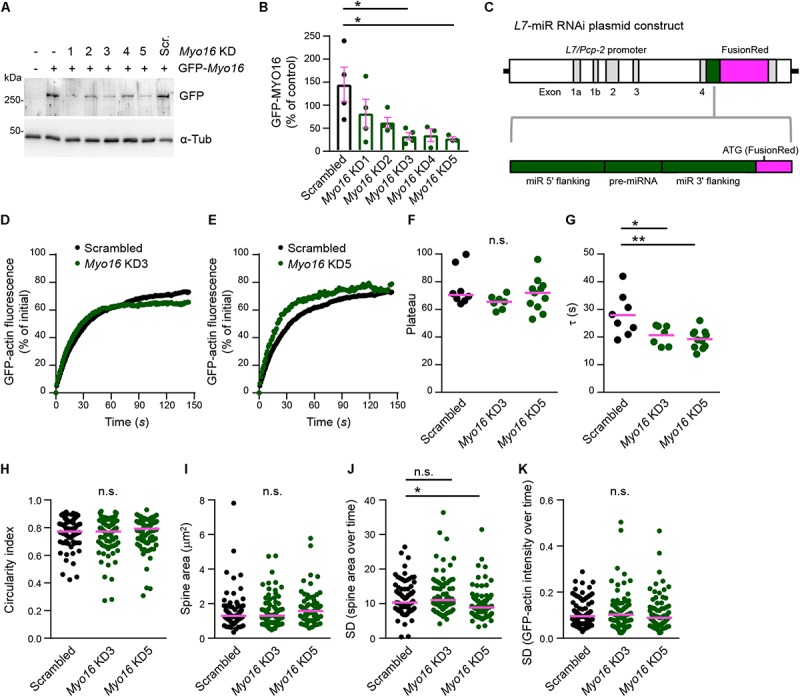
FIGURE 4.

Purkinje cell-specific Myo16 knockdown leads to accelerated F-actin turnover in dendritic spines. (A,B) Identification of Myo16 miR RNAi knockdown constructs. (A) Western blot analysis of HEK293 cells co-transfected with a plasmid encoding mGFP-tagged mouse MYO16 and pcDNATM6.2-GW/EmGFP-miR plasmids carrying the indicated knockdown sequences (Myo16 KD1–KD5) or scrambled control (Scr.). For control, untransfected cells (first lane) and cells transfected only with plasmid encoding mGFP-Myo16 were used. Antibodies against GFP and α-Tubulin (α-Tub; loading control) were used. (B) Quantification of GFP-MYO16 protein amount upon co-transfection with Myo16 knockdown constructs KD1–KD5 or scrambled control. Graph depicts GFP-MYO16 signals normalized to tubulin signals and expressed as percentage of control (i.e., cells transfected with GFP-MYO16 plasmid only). Bars indicate mean values (n = 3–4; data points represent experiments) ± SEM (magenta); p values determined using Kruskal–Wallis test (p = 0.0321) followed by Dunn’s multiple comparisons test. (C) Schematic representation of plasmids for expressing Myo16 KD3, Myo16 KD5 or scrambled sequence (pre-miRNA) and flanking miR sequences (green) together with FusionRed as a reporter for RNAi expression (magenta) under control of the PC-specific L7/Pcp-2 promoter. (D,E) FRAP analysis of GFP-actin in spines of wild-type PCs transfected with L7/Pcp-2 promoter plasmids carrying Myo16 KD3, Myo16 KD5, or scrambled sequence and FusionRed (reporter for knockdown construct expression). Cells were co-transfected with a plasmid encoding GFP-actin. Graphs depict recovery of GFP-actin fluorescence intensity in spines, data points represent the mean of a representative experiment. For clarity, recovery curves of Myo16 KD3 (D) and Myo16 KD5 (E) are compared to the same scrambled control but shown in separate graphs. (F) GFP-actin FRAP recovery plateau in spines of PCs transfected as described in (D,E). Data are plateau values obtained from independent experiments (n = 7–11; magenta line indicates median); p value determined using Kruskal–Wallis test. (G) GFP-actin FRAP recovery time constant (τ) in spines of PCs transfected as described in (D,E). Data are τ values from independent experiments (n = 7–11; magenta line indicates mean); p values determined using one-way ANOVA (p = 0.0038) followed by Tukey’s multiple comparisons test. (H) Circularity index of spines of PCs transfected as described in (D,E). Data points represent single spines, magenta line indicates median; p value determined using Kruskal–Wallis test. (I) Apparent area covered by single spines of PCs transfected as described in (D,E). Data points represent single spines, magenta line indicates median; p value determined using Kruskal–Wallis test. (J) Spine area changes over time of PCs transfected as described in (D,E). Data points represent SD of the relative area change of single spines over 150 s, magenta line indicates median; p values determined using Kruskal–Wallis test (p = 0.0008) followed by Dunn’s multiple comparisons test. (K) Change of GFP-actin fluorescence intensity over time in spines of PCs transfected as described in (D,E). Data points represent SD of the relative fluorescence change of single spines monitored over 150 s, magenta line indicates median. For reasons of comparability with the other figures, a single data point of Myo16 KD5 lying above the Y-axis limit is not shown; p value determined using Kruskal–Wallis test. *p < 0.05; ∗∗p < 0.01; ∗∗∗p < 0.001; ****p < 0.0001; n.s., not significant.
