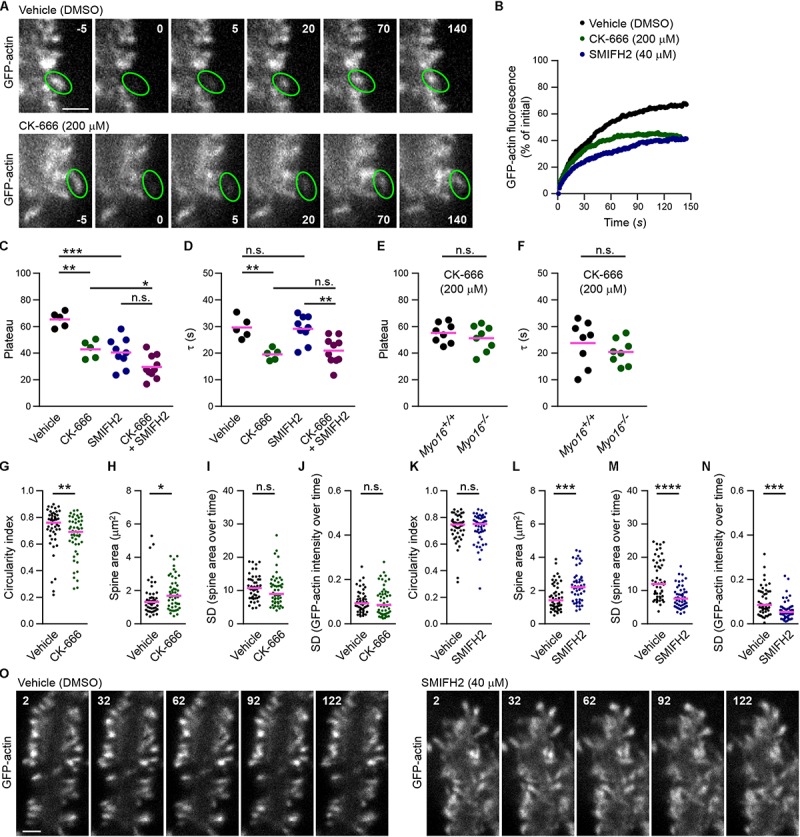
FIGURE 7.

Arp2/3 inhibition, but not formin inhibition, accelerates F-actin turnover in PC spines. (A) Examples of GFP-actin FRAP in PC spines in the absence or presence of Arp2/3 inhibitor CK-666. Wild-type PCs were co-transfected with L7/Pcp-2 promoter plasmids encoding GFP-actin and volume marker FusionRed. Shown are images depicting GFP-actin and recorded using spinning disk confocal microscopy. Upper row, vehicle-treated control (0.4% [v/v] DMSO). Lower row, treated with CK-666 (final concentration, 200 μM). Time before and after bleaching is indicated (seconds). Green ovals highlight bleached spines. Scale bar, 2 μm. (B) FRAP analysis of GFP-actin in spines of PCs co-transfected as in (A) and treated with CK-666 (200 μM; green), formin inhibitor SMIFH2 (40 μM; blue), or vehicle (black). Graph depicts recovery of GFP-actin fluorescence intensity in spines, data points represent the mean of a representative experiment. (C) GFP-actin FRAP recovery plateau in spines of PCs transfected as in (A) and treated with CK-666, SMIFH2, CK-666 + SMIFH2, or vehicle. Data are plateau values obtained from independent experiments (n = 5–10; magenta line indicates mean); p values determined using one-way ANOVA (p < 0.0001) followed by Sidak’s multiple comparisons test. (D) GFP-actin FRAP recovery time constant (τ) in spines of PCs transfected as in (A) and treated with CK-666, SMIFH2, CK-666 + SMIFH2, or vehicle. Data are τ values obtained from independent experiments (n = 5–10; magenta line indicates mean); p values determined using one-way ANOVA (p = 0.0003) followed by Sidak’s multiple comparisons test. (E) GFP-actin FRAP recovery plateau in spines of Myo16em2 knockout PCs (Myo16–/–) and Myo16+/+ littermate PCs transfected as in (A) and treated with CK-666. Data represent plateau values obtained from independent experiments (n = 8; magenta line indicates mean); p value determined using Student’s t-test. (F) GFP-actin FRAP recovery time constant (τ) in spines of Myo16em2 knockout PCs (Myo16–/–) and Myo16+/+ littermate PCs transfected as in (A) and treated with CK-666. Data represent plateau values obtained from independent experiments (n = 8; magenta line indicates mean); p value determined using Student’s t-test. (G) Circularity index of spines of PCs treated with CK-666 or vehicle and transfected as in (A). Data points (represent single spines, magenta line indicates median; p value determined using Mann–Whitney test. (H) Apparent area covered by single spines of PCs treated with CK-666 or vehicle and transfected as in (A). Data points represents single spines, magenta line indicates median; p value determined using Mann–Whitney test. (I) Spine area changes over time of PCs treated with CK-666 or vehicle and transfected as in (A). Data points represent SD of the relative area change of single spines monitored over 150 s, magenta line indicates median; p value determined using Mann–Whitney test. (J) Change of GFP-actin fluorescence intensity over time in spines of PCs treated with CK-666 or vehicle and transfected as in (A). Data points represent the SD of the relative fluorescence change of single spines monitored over 150 s, magenta line indicates median; p value determined using Mann–Whitney test. (K) Circularity index of spines of PCs transfected as in (A) and treated with SMIFH2 (blue; final concentration, 40 μM) or with vehicle (0.2% [v/v] DMSO; black). Data points represent single spines, magenta line indicates median; p value determined using Mann–Whitney test. (L) Apparent area covered by single spines of PCs treated with SMIFH2 or vehicle and transfected as in (A). Data points represent single spines, magenta line indicates median; p value determined using Mann–Whitney test. (M) Spine area changes over time of PCs treated with SMIFH2 or vehicle and transfected as in (A). Data points represent SD of the relative area change of single spines monitored over 150 s, magenta line indicates median; p value determined using Mann–Whitney test. (N) Change of GFP-actin fluorescence intensity over time in spines of PCs treated with SMIFH2 or vehicle and transfected as in (A). Data point represent SD of the relative fluorescence change of single spines monitored over 150 s, magenta line indicates median; p value determined using Mann–Whitney test. (O) Examples of spines of PCs treated with SMIFH2 or vehicle and transfected as described in (A). GFP-actin was visualized by spinning disk confocal microscopy. Time is indicated in seconds. Scale bar, 2 μm. *p < 0.05; ∗∗p < 0.01; ∗∗∗p < 0.001; ****p < 0.0001; n.s., not significant.)
