FIGURE 8.

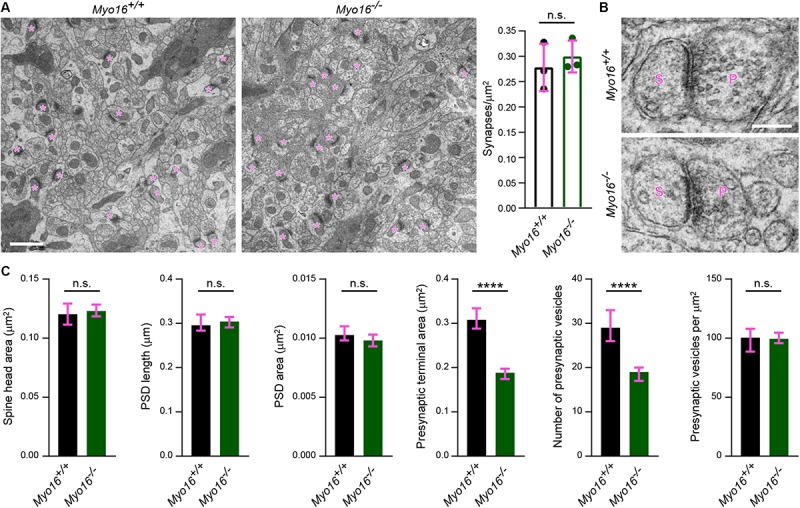
Ultrastructural analysis reveals altered presynaptic organization in the cerebellar molecular layer of Myo16–/– knockout mice. (A) Electron microscopy images of the middle one third of the cerebellar molecular layer of adult male Myo16em3 knockout (Myo16–/–) and Myo16+/+ littermate control mice were surveyed for asymmetric synapses (indicated by magenta asterisks). Graph shows number of synapses per μm2; bars indicate mean ± SEM (magenta), n = 3 (single data points represent mice analyzed), no significant differences detected (n.s.; p value determined using Student’s t-test). Scale bar, 1 μm. (B) Representative electron microscopy images of cerebellar molecular layer synapses of adult male Myo16em3 knockout (Myo16–/–) and Myo16+/+ littermate mice. S, spine; P, presynaptic bouton. Scale bar, 250 nm. (C) Quantitative analysis of morphological parameters of cerebellar molecular layer synapses of Myo16–/– and Myo16+/+ mice. Data are shown as median ± 95% confidence interval (magenta), n = 236 synapses (Myo16+/+) and 380 (Myo16–/–); p values determined using Mann–Whitney tests. *p < 0.05; ∗∗p < 0.01; ∗∗∗p < 0.001; ****p < 0.0001; n.s., not significant.
