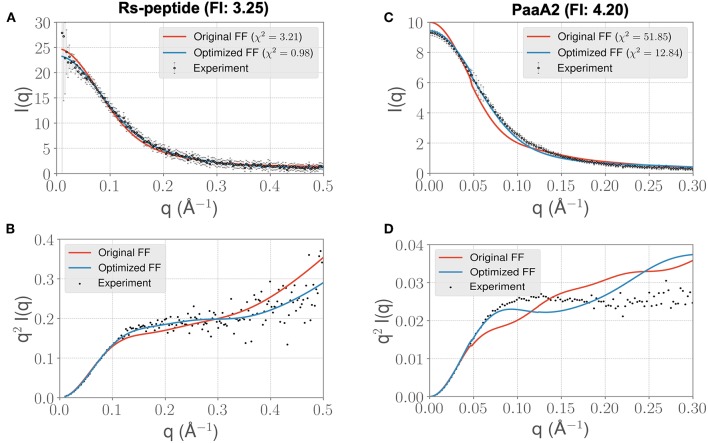
Figure 3.
ForceBalance-SAS based simulations generate IDP ensembles that are better fit to the experimental SAXS observables at shorter timescales. (A) The scattering profiles for RS-peptide showing the experimental data (black dots with error bars) along with the predicted SAXS scattering profiles from the original FF simulations (red lines) vs. the optimized FF simulations (blue lines). For clarity, the χ2 values between the experiment and the respective simulations are shown in the legend. (B) The Kratky plot from experiments (black dots), and predicted profiles from simulations (red line corresponding to the original FF, blue line—optimized FF). For clarity, the error bars from the experiments are excluded. (C,D) Highlight the same comparison for the PaaA2 system. The factor improvement (FI) in the χ2 values between the optimized and original FFs are listed above each protein system.

