Figure 4.
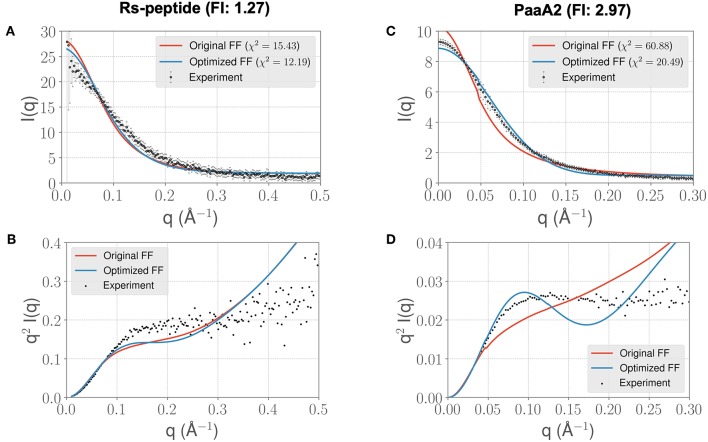
Longer timescale simulations using the ForceBalance-SAS optimized FF parameters preserve improvement with experimentally observed scattering profiles. (A) The scattering profiles for RS-peptide showing the experimental data (black dots with error bars) along with the predicted SAXS scattering profiles from the original FF simulations (red lines) vs. the optimized FF simulations (blue lines). For clarity, the χ2 values between the experiment and the respective simulations are shown in the legend. (B) The Kratky plot from experiments (black dots), and predicted profiles from simulations (red line corresponding to the original FF, blue line—optimized FF). For clarity, the error bars from the experiments are excluded. (C,D) Highlight the same comparison for the PaaA2 system. The factor improvement (FI) in the χ2 values between the optimized and original FFs are listed above each protein system. Note that the FI in each simulation has decreased compared to the shorter timescales (Figure 3)—however, still preserves the overall trends. It is also notable that the fits of the MD simulations to the longer q values are poorer in both cases.

