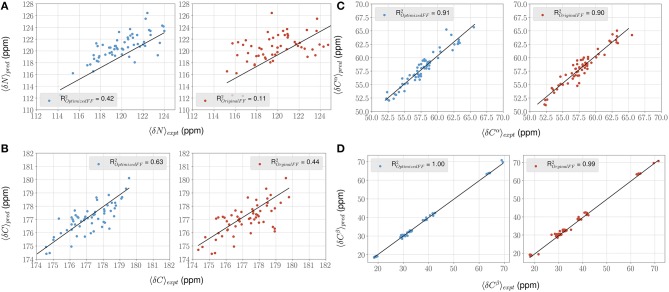
Figure 5.
ForceBalance-SAS improves agreement with NMR chemical shift observables for the PaaA2 ensemble. (A–D) Panels highlight the comparison between the average experimental (x-axis) chemical shift vs. predicted (y-axis) chemical shift values for N, Cα, C, and Cβ atoms, respectively. Predictions from the optimized FF (blue dots) are compared with the original FF (red dots) simulations along with the R2 value for the fits (shown as black lines). Error bars are not highlighted for clarity.

