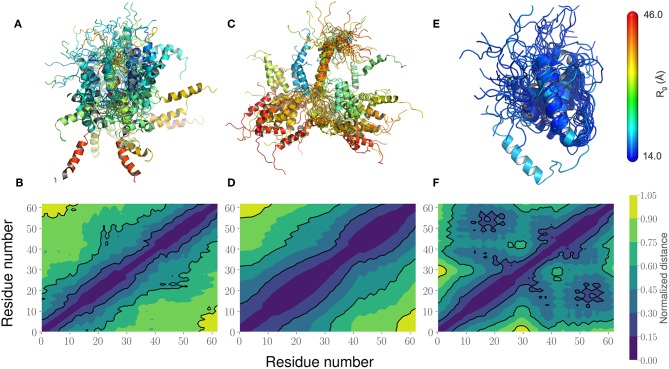
Figure 6.
Comparison of the PaaA2 Ensembles determined from experiments and simulations highlight regions of long-range interactions between the two α-helices. (A) A cartoon depiction of the PaaA2 ensemble determined using SAXS and NMR techniques using Flexible-Meccano. (B) Shows the normalized mean distance matrix showing the various interactions between residues; shades of blue indicate proximity in the chain—implying the increased likelihood of interactions. (C) Cartoon representation of the PaaA2 ensemble from the original FF along with the (D) normalized mean distance matrix. Note that many of the conformations are in the extended state—indicating less likelihood of interactions between the α-helices. (E) Cartoon representation from the PaaA2 ensemble from the optimized FF simulation along with the (F) normalized mean distance matrix. The conformations generated by the optimized FF are more compact than the other two datasets mainly because the sampling from the optimization runs are limited.

