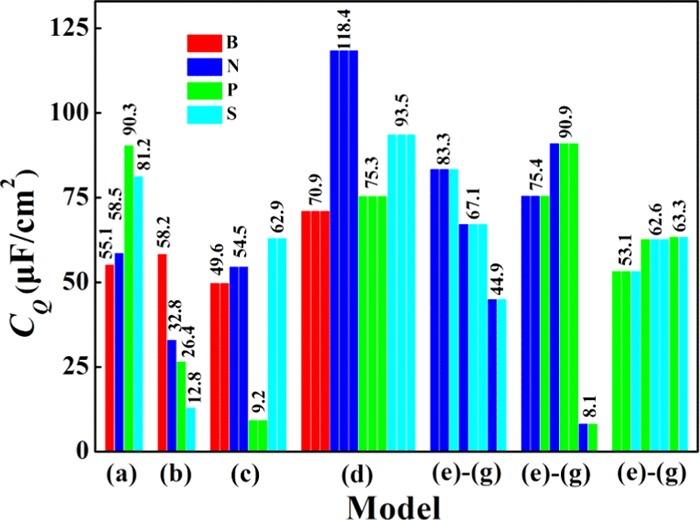
Figure 7.

Change trend chart of the maximum value of CQ for the B(N, P, S)-doped graphene with different doping models (model-a, model-b, model-c, and model-d) and the N/S, N/P-co-doped graphene with different models (model-e, model-f, and model-g). The results are obtained with the supercell 4 × 4.
