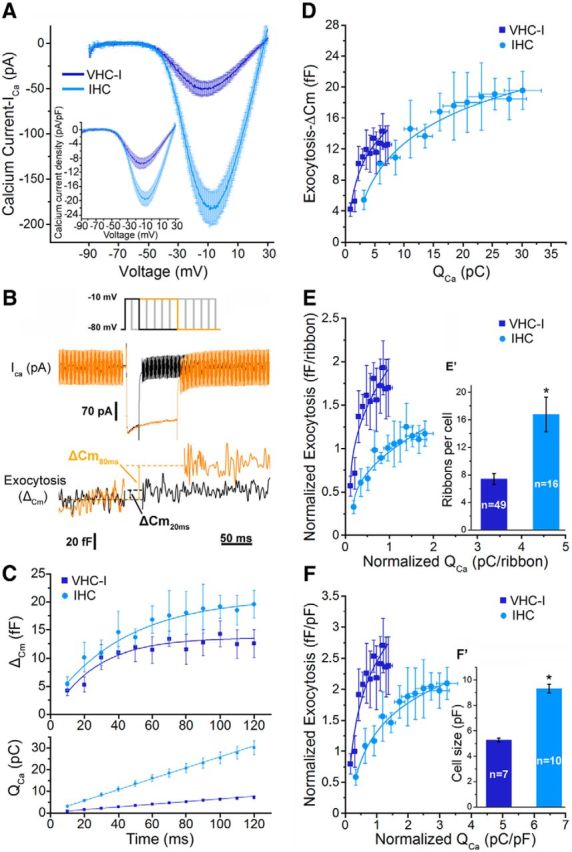
Figure 1.

Kinetics of RRP release in Type I vestibular hair cells (VHC-I, dark blue) and inner hair cells (IHCs, light blue). A, IV-ramp activation curve of Ca2+ currents in VHC-I (n = 7) and IHCs (n = 10) from −90 mV to 30 mV (1 mV/ms). Inset, Ca2+ current density relative to cell size (pA/pF). B, Examples of ICa and capacitance measurements (ΔCm) in IHCs for 20 ms (black) and 80 ms (orange) depolarization duration. Cells were depolarized from holding potential −80 mV to −10 mV with various time durations (from 10 to 120 ms). C, ΔCm values were plotted against depolarization duration (top). Data were best fitted with a monoexponential function where τ = 35.7 ± 5.7 ms (n = 7) and τ = 35.4 ± 6.3 ms (n = 9) in VHC-I and IHCs, respectively. Bottom, Ca2+ current charge integrals (QCa) plotted against time (linear fit). D, ΔCm values plotted against QCa (data from C) were fitted with a simple power function with index of 0.51 and 0.46 in VHC-I and IHCs, respectively. E, ΔCm values plotted against QCa normalized to the number of ribbon (E′). F, ΔCm values plotted against QCa to cell size (F′). Error bars indicate SEM. *p < 0.05.
