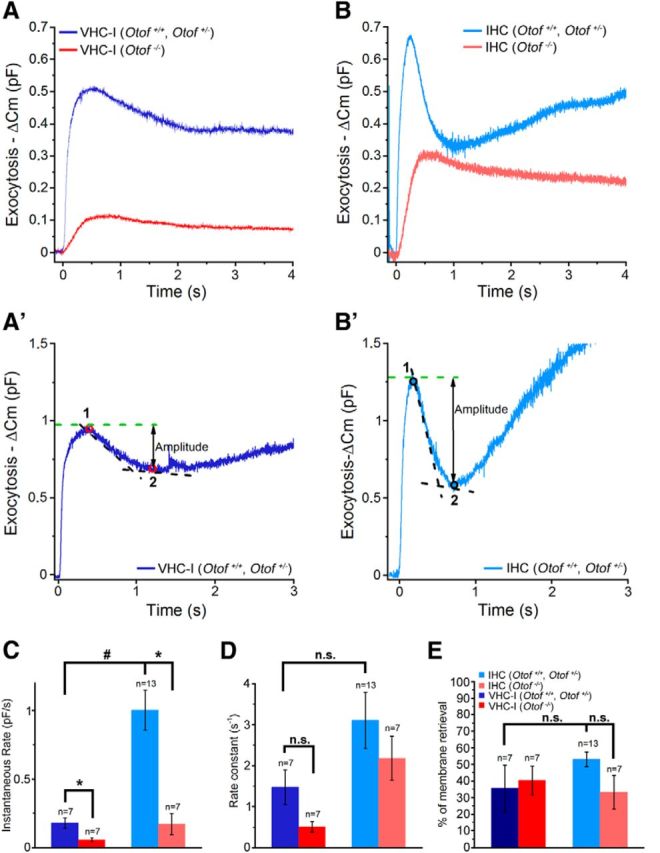
Figure 10.

Endocytosis in VHC-I and IHCs. A, A single high-intensity UV flash rising [Ca2+]i near 80 μm (data not shown) produced a large ΔCm response in control VHC-I (dark blue line, mean of 7 cells) and a reduced ΔCm response in Otof −/− VHC-I (red line, mean of 7 cells). B, Same as in A but in control IHCs (light blue line, mean of 13 cells) and in Otof −/− IHCs (red line, mean of 7 cells). A′, B′, Example of endocytosis in VHC-I and IHCs, respectively. Endocytosis was essentially analyzed as described by Neef et al. (2014). Briefly, the amplitude of fast endocytosis was measured as the difference between the maximum ΔCm (“1”) and the point where the rate of endocytosis is reduced to 5% of the instantaneous rate (“2”). To calculate the endocytotic instantaneous rate, we used a linear fit function at the point giving the faster rate between point “1” and point “2”. C, Histogram plot of the endocytotic instantaneous rate obtained in each group. We found a reduced instantaneous rate in Otof−/− VHC-I compared with VHC-I controls (p = 0.011) but also in Otof−/− IHCs compared with IHCs controls (p = 0.006). D, Rate constants were obtained after normalizing the instantaneous rate to the amplitude of endocytosis. No statistical differences were found between control and Otof−/− mice (VHC-I, p = 0.051; IHCs, p = 0.55). E, Percentage of membrane retrieval at the point corresponding to 5% of the maximal instantaneous rate (point “2”) normalized by the amplitude of exocytosis ((“1” − “2”)/“1” × 100). The absence of otoferlin did not interfere with the endocytotic capability of VHC-I and IHCs. C–E, Results are expressed as mean ± SEM. *p < 0.05. # p < 0.001. n.s., No statistical difference.
