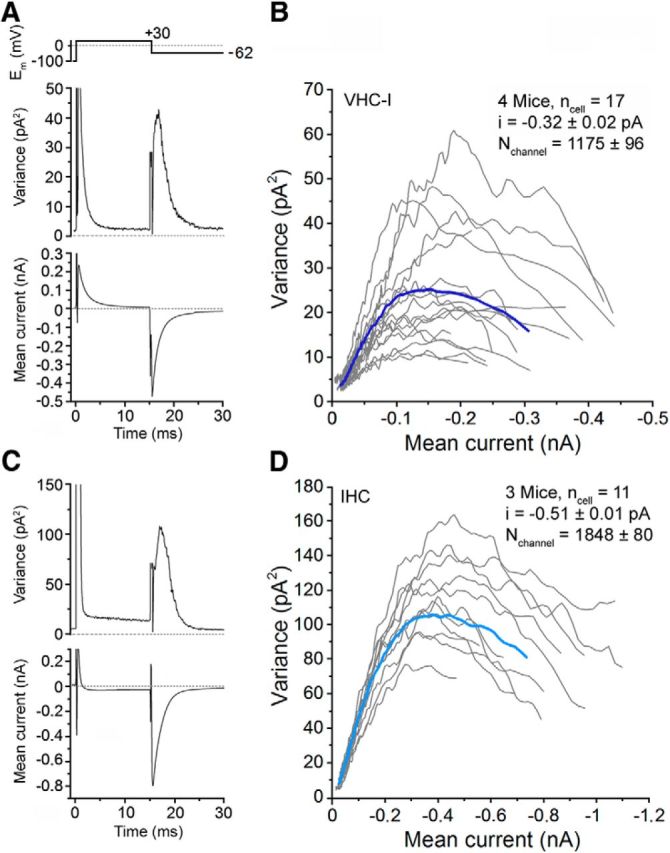
Figure 2.

Counting Ca2+ channels in VHC-I and IHCs. Variance analysis of Ca2+ tail currents were performed from an ensemble of 500 sweeps (interval, 80 ms) after leak subtraction in one example of VHC-I (A) and IHCs (C). The plot of the variance against the current represents a characteristic parabolic relationship in VHC-I (B) and IHCs (D). Gray lines indicate the response of individual cells. Dark blue (VHC-I, B) and light blue (IHCs, D) lines indicate the average of each cell type. ncell, Number of cells; i, unitary current; Nchannel, number of Ca2+ channels. Recordings were performed in presence of 10 mm Ca2+, 1 mm Ba2+, and 5 μm BayK8644.
