Figure 4.

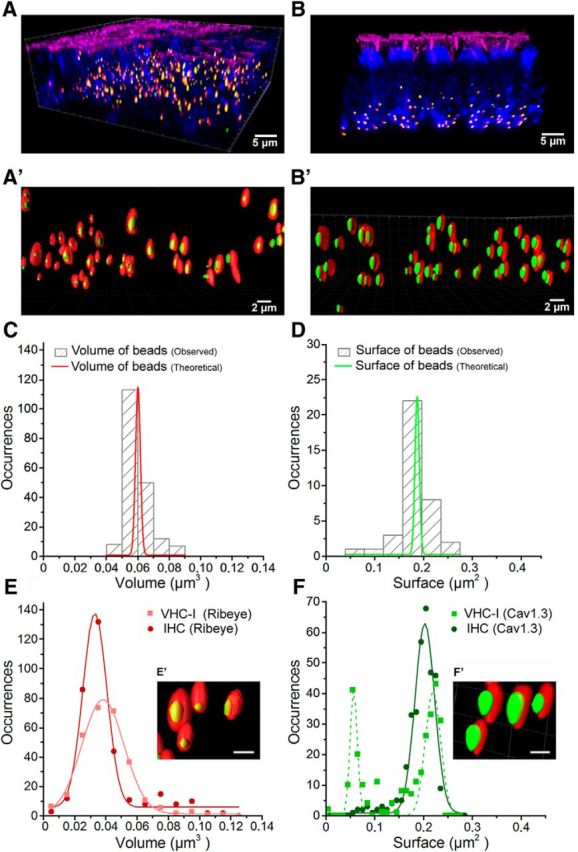
Spatial distribution of Cav1.3 channels in VHC-I and IHCs. A, B, 3D Imaris reconstructions of confocal images from the central striolar region of an utricle and the low-frequency apical turn of an OC, respectively. Both organs were dissected from mice at P14. Hair cells were stained for F-actin (phalloidin, pink), otoferlin (anti-otoferlin, blue), ribbons (anti-CtBP2, red), and Cav1.3 (anti-α 1D, green). A′, B′, 3D-reconstructed images at higher magnification of some ribbons and their associated Cav1.3 cluster in vestibular (A′; VHC-I) and cochlear hair cells (B′; IHCs). It is to be noted that these images are 3D stack reconstructions. The distance between ribbons as well as their size are here distorted in 2D representation. C, Fluoresbrite YO carboxylate microspheres were taken as reference for the ribbon volume analysis (see Materials and Methods). The hatched gray bars represent the observed volume distribution of the beads (after correction for oblate and prolate image distortion) compared with their theoretical value (red). D, Fluoresbrite Yellow Green microspheres were taken as references for the spheroid surface analysis of Cav1.3 clusters. Hatched gray bars represent the observed surface distribution of the bead surfaces compared with their theoretical value (green). E, Volume distribution analysis of ribbons in VHC-I (light red, filled squares) and IHCs (dark red, filled circles) displayed no significant difference (VHC-I, 291 ribbons, 0.038 ± 0.001 μm3; IHCs, 333 ribbons, 0.033 ± 0.001 μm3, p = 0.90). F, Surface distribution analysis of Cav1.3 clusters. In VHC-I, Cav1.3 channel clusters distributed in two equal populations of small (0.056 ± 0.001 μm2) and large (0.209 ± 0.002 μm2) clusters (green dashed line). In IHCs, the distribution of Cav1.3 channel clusters was fitted with a simple Gaussian (0.194 ± 0.002 μm2; dark green). E′, F′, Insets, Synaptic ribbons at high magnifications in one VHC-I (E′) and one IHC (F′). Scale bar, 1 μm.
