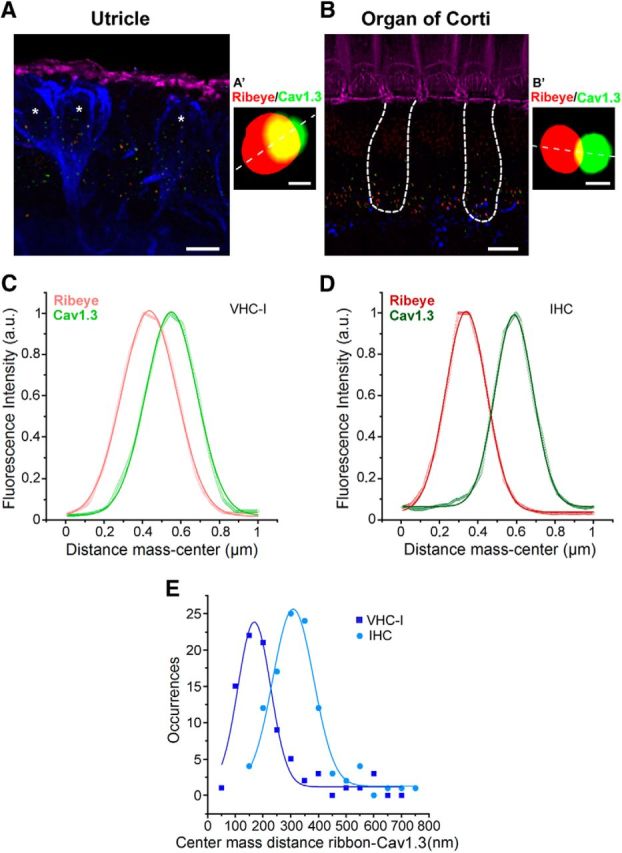
Figure 5.

Colocalization between Cav1.3 channels and ribbons. A, B, 3D stack reconstruction of confocal images of utricle (A, striolar region) and OC (apical region, B). Organs (P14) were labeled for F-actin (pink), Cav1.3 (green), and CtBP2 (red ribbons). Afferent fibers were labeled with Anti-NF200 (blue). Asterisks indicate VHC-I surrounded by large calyceal nerve terminals. Scale bar, 6 μm. An example of a Cav1.3 channel cluster (green) and its ribbon (red) is shown for VHC-I (A′) and IHCs (B′). Scale bar, 0.25 μm. C, D, Colocalization between Cav1.3 and ribbon (CtBP2-ribeye) was assessed by plotting the fluorescence intensity profile from a line scan (A′, B′, white dashed line). An example of fluorescence intensity profile is shown for VHC-I (C) and IHCs (D). E, Colocalization analysis using JACoP plugin in ImageJ. Gaussian fit of the occurrences of center mass distance measured between ribbon and Cav1.3 VHC-I (167.77 ± 4.53 nm, n = 83) and IHCs (308.34 ± 4.68 nm, n = 106) suggested a tighter organization of Cav1.3 channels and ribbons in VHC-I.
