Figure 6.

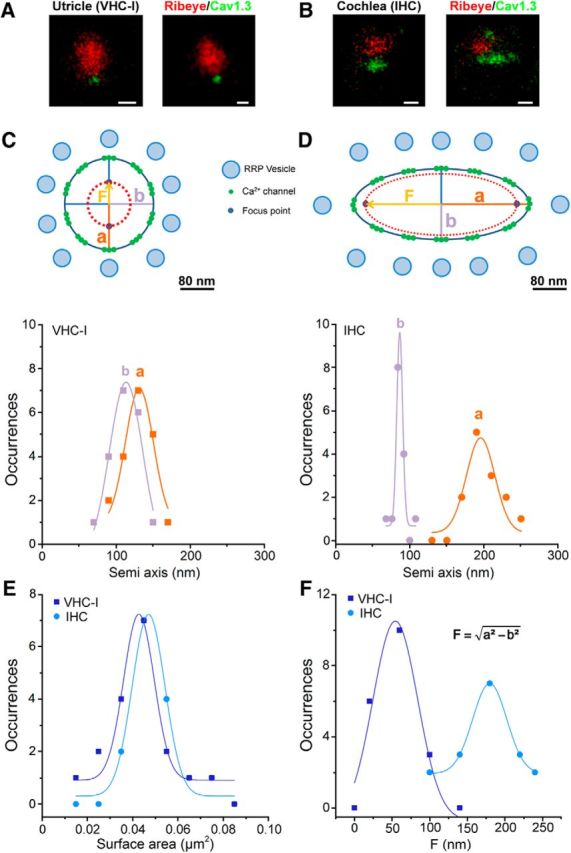
Ca2+ channel organization in VHC-I and IHCs by STED microscopy. A, B, Two examples of STED images of immunolabeled ribbon (anti-CtBP2, red) and Ca2+-channel (anti-Cav1.3 green) in P21 VHC-I (A) and P21 IHCs (B). Scale bars, 200 nm. C, D, Semiaxis (a, b) size distribution in VHC-I (C) and IHCs (D). Data points were fitted by a simple Gaussian. The long semi axis “a” and short semi-axis “b” are of similar values in VHC-I (C), whereas they show a nearly 2 times difference in IHCs (D). This suggested that the arrangement of the Ca2+ channels clusters at the ribbon membrane forms an elongated stripe-like ellipsoide in IHCs and a nearly circular disk in VHC-I. C, D, Top, Schematic representation of the active zone below the ribbon in VHC-I and IHCs. Assuming that the Ca2+ channels are uniformly distributed at the edge of the ellipse, an elongated ellipsoid distribution would give a larger distance for the interacting focus points of Ca2+ influx in IHCs compared with VHC-I. “F” represents the distance between the center of the ellipse and each focus point. The model assumes that Ca2+ channels are organized as individual nanodoamains for brief low-voltage stimulation (near threshold) and as microdomains with linear summation of Ca2+ activity for long high-voltage stimulations. This summation of Ca2+ influx would be more efficient in VHC-I than in IHCs. E, Similar mean surface distribution of Cav1.3 clusters in VHC-I and IHCs. F, Distribution and Gaussian fit of the distance between focus points and the center of the ellipse (“F”) in VHC-I (“F” = 54.4 ± 5.9 nm) and IHCs (“F” = 179.9 ± 0.9 nm).
