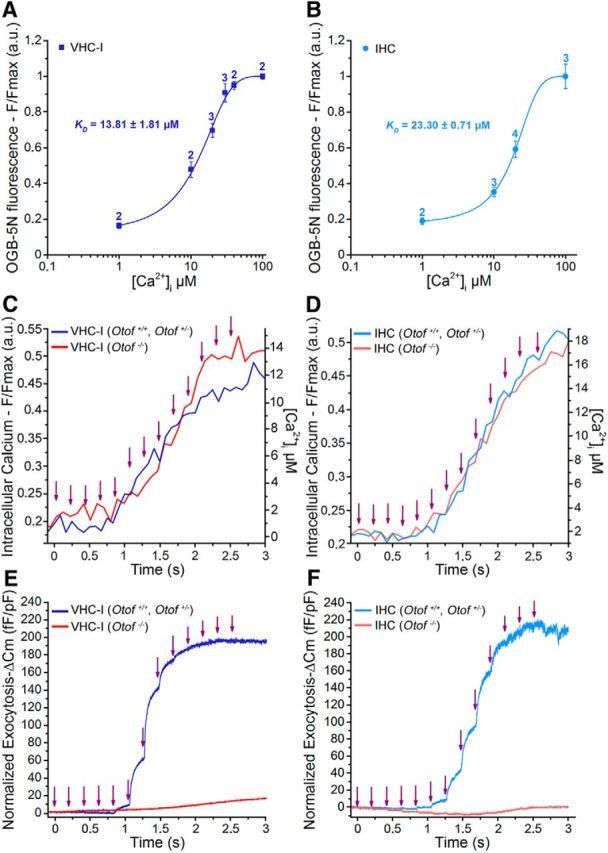
Figure 8.

Step increase in [Ca2+]i and exocytosis evoked by multiflash Ca2+ uncaging. A, B, In vivo calibration of the calcium dye OGB-5N in VHC-I (A) and IHCs (B) gave a dissociation constant close to the theoretical value of 20 μm (13.81 μm VHC-I and 23.30 μm IHCs). Numbers above each data point indicate the number of cells. C–F, Simultaneous recording of [Ca2+]i (F/Fmax) and ΔCm (normalized to cell size) during the multiflash protocol (purple arrow indicates each UV flash) in VHC-I (C, E) and IHCs (D, F). Control VHC-I (dark blue line, mean of n = 7) and Otof −/− VHC-I (red line, mean of n = 10); control IHCs (light blue, mean of n = 9) and Otof −/− IHCs (red line, mean of n = 7).
