
Figure 9.
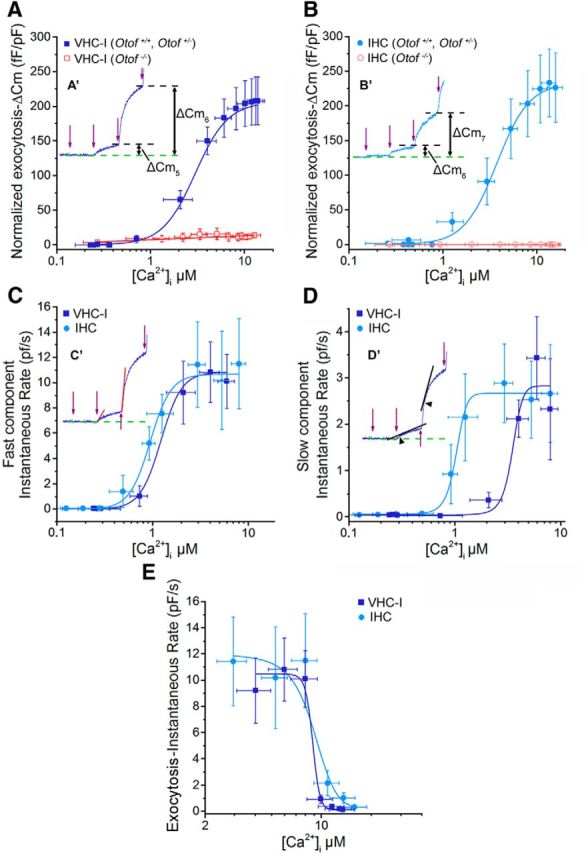
Determination of Ca2+ sensitivity of exocytosis in VHC-I and IHCs. A, B, From the experiments of Figure 8, mean ΔCm responses at each UV flash were plotted against corresponding [Ca2+]i for VHC-I (A) and IHCs (B). A′, B′, Insets, ΔCm after two UV flashes (fifth flash: ΔCm5 and sixth flash: ΔCm6) in control mice. ΔCm responses in Otof −/− VHC-I and Otof −/− IHCs show a very poor Ca2+ dependence (red lines). A′, B′, The black dashed lines indicate the ΔCm plateau after each UV flash. Data points were fitted with a Hill sigmoidal function. C, The instantaneous rate of the ΔCm fast component after each UV flash was plotted against [Ca2+]i for VHC-I (dark blue) and IHCs (light blue). C′, Inset, The method used to measure the instantaneous rate of the fast component. We used a linear function to fit the first 20 ms of the capacitance response (red lines). As in A and B, we used a Hill sigmoidal function to fit these data points. D, The second slow component of the ΔCm response was also plotted against [Ca2+]i. D′, Inset, The method used. We linearly fitted the first 50 ms (black lines) after the deflection point of the response (arrowhead). Data points were fit with a Hill sigmoidal function. E, The instantaneous rate of the fast ΔCm responses deeply decreased at [Ca2+]i >8 μm. Data points were fitted with a decreasing sigmoidal function to obtain Ki (constant of inhibition) of exocytosis, which we considered as the KD for endocytosis.