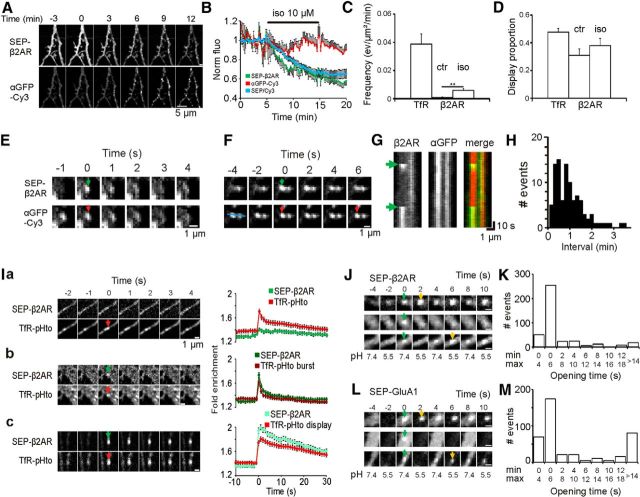
Figure 8.
Multiple exocytosis events in single REs. A, Images of a neuron transfected with SEP–β2AR and incubated with αGFP–Cy3. Isoproterenol, applied for 10 min at time 0, induces within minutes the formation of αGFP–Cy3 clusters. B, Whole-cell fluorescence of SEP–β2AR (green curve) and αGFP–Cy3 (red curve), normalized and averaged for six cells. The blue curve shows the ratio of SEP–β2AR/αGFP–Cy3 fluorescence. C, Frequency of exocytosis of TfR–SEP (n = 9 cells), β2AR (n = 10), and β2AR after stimulation with isoproterenol (Iso; 10 μm; n = 10). Application of agonist increased significantly the frequency of β2AR exocytosis (**p < 0.01). D, Proportion of display events from the same sample as in C. E, F, Top, Images of burst (E) and display (F) events occurring at sites of αGFP–Cy3 enrichment (bottom). G, Kymographs made along the blue line in F, starting 30 s after agonist washout. They show two successive exocytosis events detected in the left cluster of αGFP–Cy3, separated by 58 s. H, Histogram of the intervals between two exocytosis events from the same αGFP–Cy3 cluster (98 events in 7 cells). I, Left, Events detected in cells cotransfected with SEP–β2AR and TfR–pHto, during isoproterenol washout. Right, Quantification of fluorescence normalized to whole-cell fluorescence for both red (TfR–pHto) and green (SEP–β2AR) channels for sorted populations. a, Events detected with TfR–pHto but without detectable SEP–β2AR. Burst (b) and display (c) events are reported by both receptors simultaneously. J, Events recorded in neurons expressing SEP–β2AR during ppH. Images at pH 5.5 are shown at 2× contrast for clarity. The three events shown represent the three main behaviors also seen with TfR–SEP (see Fig. 2B). Green arrows mark the time of exocytosis, and yellow arrows indicate the appearance of an acid-resistant cluster. K, Histogram of estimated open times built as in Figure 3C (396 events in 14 cells). L, Events recorded in neurons expressing SEP–GluA1 during ppH. Same as in J. M, Histogram of estimated open times built as in Figure 3C (408 events in 11 cells).

