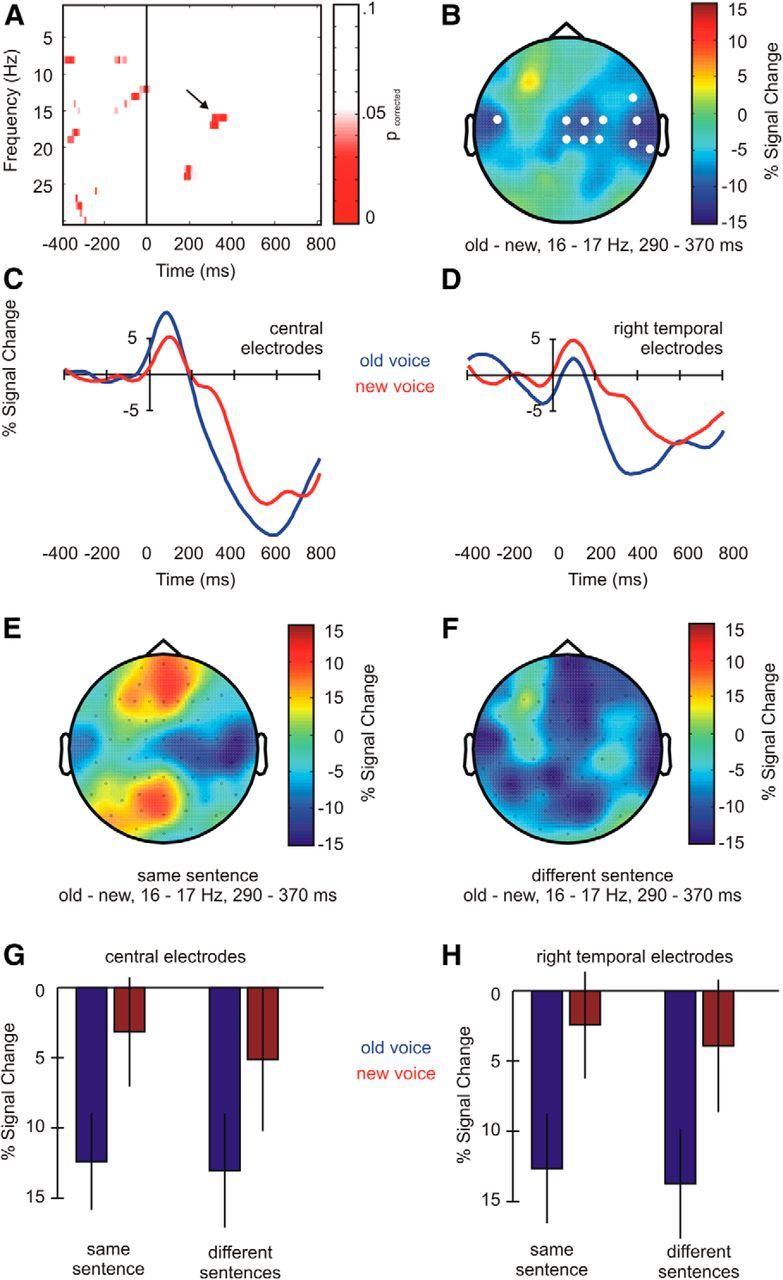
Figure 6.

Results of the time-frequency analyses. A, Significant time and frequency ranges (p-values) obtained from permutation tests. Only results with more than 10 adjacent significant bins were considered. The relevant time and frequency range is marked. B, Head topography of the mean signal change, old versus new voices, at the relevant time and frequency range. Significant electrodes are marked. C, Waveforms showing the mean signal chance (16–17 Hz) for old and new voices at the central electrode group. The waveforms show an amplitude drop after ∼300 ms that was stronger for old compared with new voices. D, Same as C, but for the right temporal electrode group. E, Head topography of the mean signal change, old versus new voices, for the “same sentence” condition. F, Same as E, but for the “different sentence” condition. G, Bar graph showing the mean signal change (± SEM) in each condition at the central electrode group. H, Same as G, but at right temporal electrodes.
