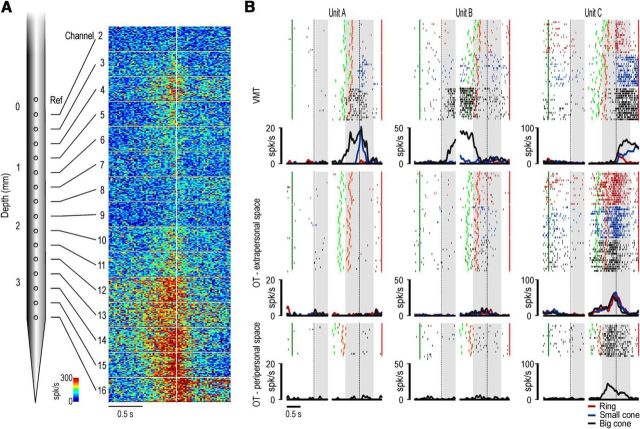
Figure 3.
A, Schematic drawing of a linear multielectrode probe and example of the multiunit activity simultaneously recorded during a typical penetration. The multiunit activity, which is the aggregate spiking activity of a number of neurons in the vicinity of an electrode (Supèr and Roelfsema, 2005), is plotted in spikes based on color code and aligned (white line) on the moment when the monkey started pulling the target object (45 trials for each panel, with the three objects pooled together). The location of this penetration, performed in M1, is shown by the asterisk in the functional map of Figure 2. B, Example of a purely motor neuron (Unit A), a canonical neuron (Unit B), and a mirror neuron (Unit C), simultaneously recorded and off-line sorted from the multiunit activity of channel 13 of the penetration shown in A. For each neuron, the gap in the histogram and rastergram is used to indicate that the activity on its left side has been aligned on object presentation (first vertical dashed line in the left panel), whereas that on its right side is aligned on the pulling onset (second vertical dashed line in the right panel) of the same trial. The gray shaded areas represent the time windows used for statistical analysis of neuronal response. Markers: dark green, cue sound onset; light green, cue sound offset (go signal); orange, detachment of the hand from the starting position (reaching onset); red, reward delivery at the end of the trial. The same markers have been used to identify the behavioral event of interest of both the visuomotor and observation tasks.

