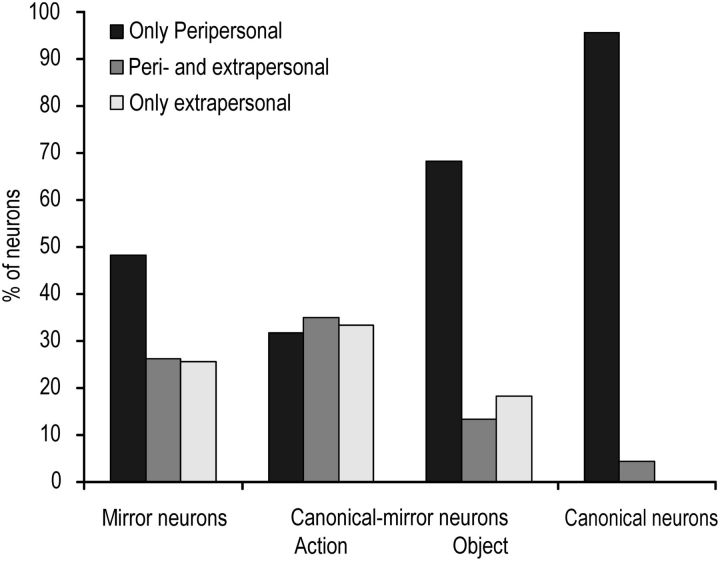
Figure 6.
Histograms showing the relative proportion of mirror, canonical-mirror, and canonical neurons selectively responding to visual stimuli presented either in the peripersonal (black) or extrapersonal (white) space, or activated for stimuli presented in both space sectors (gray). Histograms for canonical-mirror neurons have been represented twice to show the space selectivity of both their response to mirror (on the left) and canonical (on the right).

