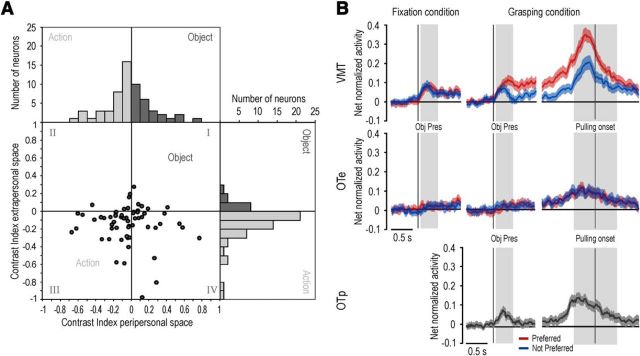
Figure 7.
A, Distribution of object-action contrast indexes computed for all canonical-mirror neurons in the peripersonal and extrapersonal space. There is a relative advantage for action (light gray bars represent negative values) compared with object (dark gray bars represent positive values) coding in the extrapersonal, but not in the peripersonal, space. B, Time course and intensity of the net normalized response of canonical-mirror neuronal population relative to the preferred (red) and not preferred (blue) target object. The activity is aligned on the light onset during fixation (left) and grasping (center) condition, as well as on the object pulling onset (right). Gray shaded regions identify the time windows used for statistical analysis of neural activity: Pulling onset divides the grasping period into two epochs: an “early grasping” (gray shading on the left of the alignment point) and “pulling” (gray shading on the right of the alignment point). Obj pres, object presentation epoch.

