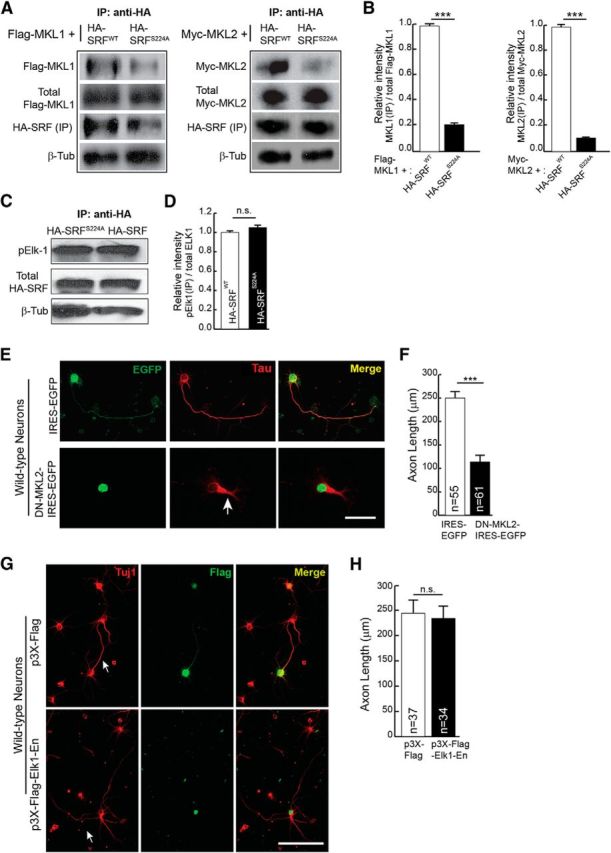
Figure 3.

Serine 224 phosphorylation is required for SRF interaction with MKL-family cofactors and not with TCF-family cofactor ELK1. A, HEK293T cells were cotransfected with HA-SRFWT or HA-SRFS224A along with Flag-MKL1 or Myc-MKL2. Immunoprecipitation with anti-HA antibody pulled down significantly less MKL1 (left) and MKL2 (right) from HA-SRF224A-transfected cells. The expression levels of Flag-MKL1, Myc-MKL2, and HA-SRF were the same in both groups of transfected cells. β-Tubulin levels in equal amounts of lysates used for IP served as loading control. B, Densitometric analysis of immunoblot in A. Error bars indicate SEM. C, Serine 224 to alanine mutation does not affect SRF interaction with the TCF-family member ELK1. HEK293T cells were transfected with HA-SRFWT or HA-SRFS224A. Immunoprecipitation with anti-HA antibody and immunoblotting for endogenous activated ELK1 using anti-phosphoELK1 (pELK1) antibody showed that a similar amount of pELK1 was immunoprecipitated with HA-SRFWT and HA-SRFS224A. Levels of SRF in the immunoprecipitates were similar and β-tubulin levels in equal amounts of lysates used for IP served as loading control. D, Densitometric analysis of immunoblot in C. Error bars indicate SEM. n.s., Not significant. E, MKL1 and MKL2 are required for axon growth. Neonatal wild-type hippocampal neurons were transfected with IRES-EGFP vector or DN-MKL2-IRES-EGFP. Expression of DN-MKL2 blocked axonal growth (arrow) as visualized with anti-Tau (red) and anti-GFP (green). Scale bar, 50 μm. F, Quantitation of D. Error bars indicate SEM; n = 3 mice. ***p < 0.001 (two-tailed t test analysis). G, Inhibition of TCF-family cofactors does not affect axonal growth. Hippocampal neurons from wild-type neonatal pups were transfected with dominant-negative Elk1-En (bottom) or empty vector (top). Cells were stained for Tuj1 (red) and Flag epitope (green) at 4 DIV. Expression of Elk1-En, which inhibits all three members of the TCF family, does not affect axonal growth. Scale bar, 50 μm. H, Quantitation of axon length in G. Error bars indicate SEM; n = 3 mice. p = 0.8087 (two-tailed t test analysis).
