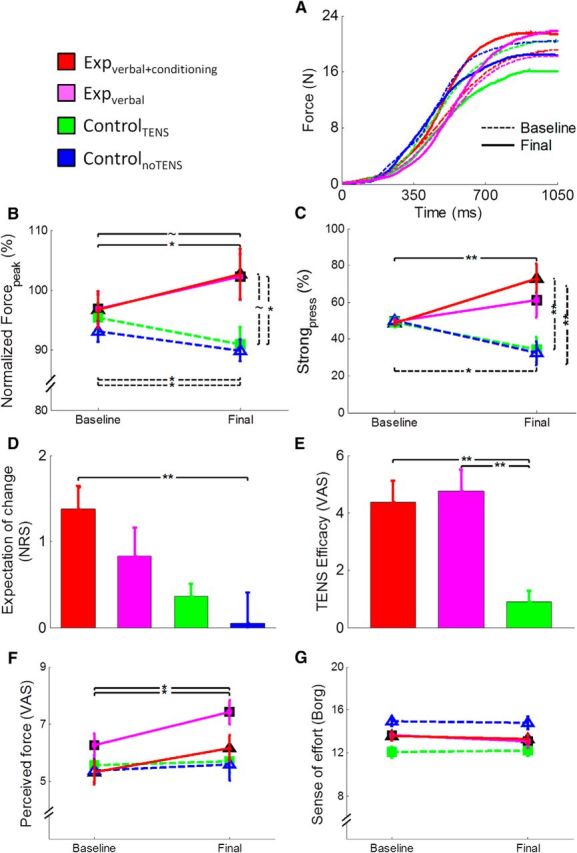
Figure 2.

Illustration of the behavioral and subjective data. A, Force profile obtained from the average of the 50 trials of the baseline (dashed lines) and final (continuous lines) sessions in one subject of the expverbal+conditioning group (red lines), one subject of the expverbal group (magenta lines), one subject of the controlTENS group (green lines), and one subject of the controlnoTENS group (blue lines). B, Mean values (±SE) of Forcepeak normalized to MVF. The expverbal+conditioning group (red line) increased the level of force in the final session compared with the baseline, and a tendency was observed in the expverbal group, whereas the controlTENS and controlnoTENS groups (green and blue lines) showed an opposite pattern, with a reduction of force. C, Percentage (±SE) of strong pressures. The expverbal+conditioning group pressed the piston more often with strong pressures in the final session compared with the baseline, whereas the two control groups showed the opposite pattern. A significant difference between groups was found in the final session. D, Mean scores (±SE) given at the expectation scale. The question related to this scale was as follows: “Do you expect that your performance will change compared with the very first session? If yes, how?” Subjects could answer on a 7 point NRS, in which positive scores indicate that they expected a benefit in force production after TENS. The expverbal+conditioning group and the expverbal group expected a positive change of performance before starting the final session. E, Mean scores (±SE) related to the efficacy of the treatment. The question related to this scale was as follows: “Was the treatment really effective in changing your performance? If yes, how much?” Subjects could answer this question on a VAS scale. Scores are reported only for the groups in which TENS was applied. As shown in the figure, the two experimental groups reported that the treatment was more effective compared with the controlTENS group. F, Mean (±SE) subjective perception of force. Perception of force was higher in the final compared with the baseline session in the two experimental groups. G, Mean scores of the sense of effort (given on the Borg scale; Borg, 1970). The four groups did not change the perception of effort from baseline to final session. **p < 0.01. *p < 0.05. ∼p < 0.059.
