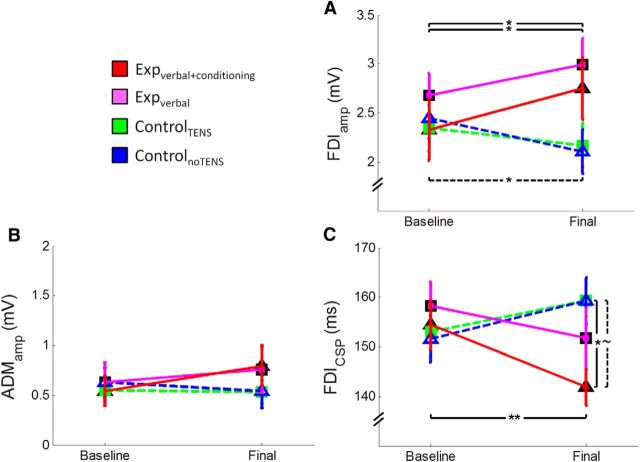
Figure 3.
Illustration of the mean (±SE) neurophysiological data obtained from the four groups of participants at the TMS task in the baseline and final sessions. A, Mean MEP amplitude (in millivolts) recorded form the FDI muscle. The expverbal+conditioning (red line) and the expverbal (magenta lines) groups showed an increase in amplitude from the baseline to the final session, whereas the controlnoTENS group showed a decrease. B, Mean MEP amplitude recorded from the ADM muscle. No difference has been found between the groups and the sessions, suggesting that the effect is specific for the FDI. C, Mean duration of the CSP (in milliseconds). A significant shortening of the CSP can be observed in the expverbal+conditioning group from baseline to final session and in respect to the two control groups in the final session. **p < 0.001. *p < 0.05. ∼p < 0.059.

