Figure 4.
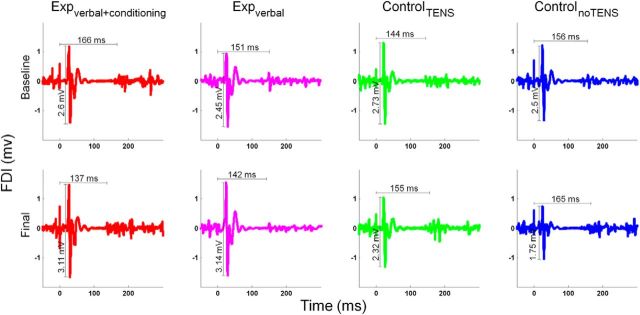
Representative neurophysiological traces recorded from the FDI muscle in one subject of the expverbal+conditioning group (red traces), one subject of the expverbal+conditioning group (magenta traces), one subject of the controlTENS group (green traces), and one subject of the controlnoTENS group (blue traces). The traces represent the average of the 16 trials of the TMS task in the baseline session (top) and in the final session (bottom). TMS pulse was delivered at 0 ms. MEP amplitude is reported in millivolts and CSP duration is shown in milliseconds. As illustrated in the figure, MEP amplitude was higher in the subjects of the experimental groups at the final session compared with baseline, whereas it was lower in the two subjects of the control groups. CSP duration was shorter in the final than in the baseline session in the subject of the expverbal+conditioning group.

