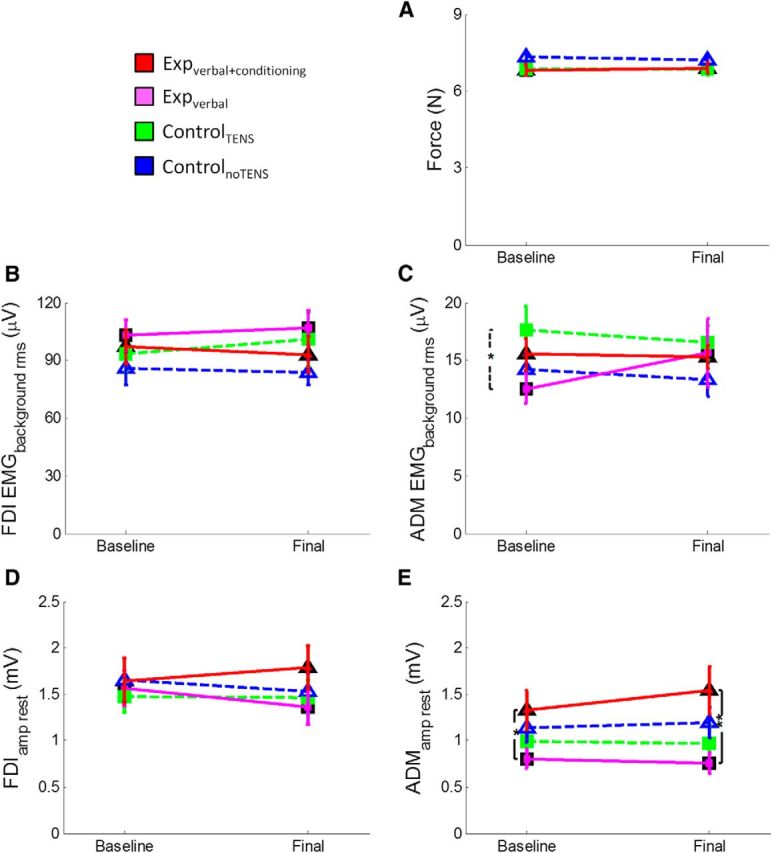
Figure 5.

A, Illustration of the mean (±SE) force level (N) of the four groups of participants in the TMS task. This task was performed after the main motor task in the baseline and final sessions. The TMS pulse was delivered when participants kept the cursor on the red line (30% MVF). Mean force level was computed from the onset of the trial until the delivery of the TMS pulse because TMS caused perturbation of the index finger pressure. As shown in the figure, the four groups exerted the same amount of force in this task, both in the baseline and final sessions. This suggests that the MEP amplitudes recorded during this task were not influenced by bottom-up factors, such as the amount of impressed force. B, Mean (±SE) EMG background activity (in microvolts) recorded from the FDI muscle before the TMS pulse. As shown in the figure, the four groups of participants had the same amount of EMG activation before MEP onset, both in the baseline and final sessions, suggesting that the MEP amplitude was not influence by the preceding EMG activity. C, Mean (±SE) EMG background activity (in microvolts) recorded from the ADM muscle before the TMS pulse. This muscle was not involved in the task; and, as shown in the figure, the amount of EMG activation was very low and comparable in the four groups of participants. D, Mean (±SE) MEP amplitude (millivolts) recorded at rest from the FDI muscle. As shown in the figure, the four groups of participants display the same amplitude both in the baseline (before starting the experiment) and final session (after completing the experiment). This suggests that the change in corticospinal excitability does not generalize at the rest condition. E, Mean (±SE) MEP amplitude (millivolts) recorded at rest from the ADM muscle. Results were the same as obtained from the FDI muscle.
