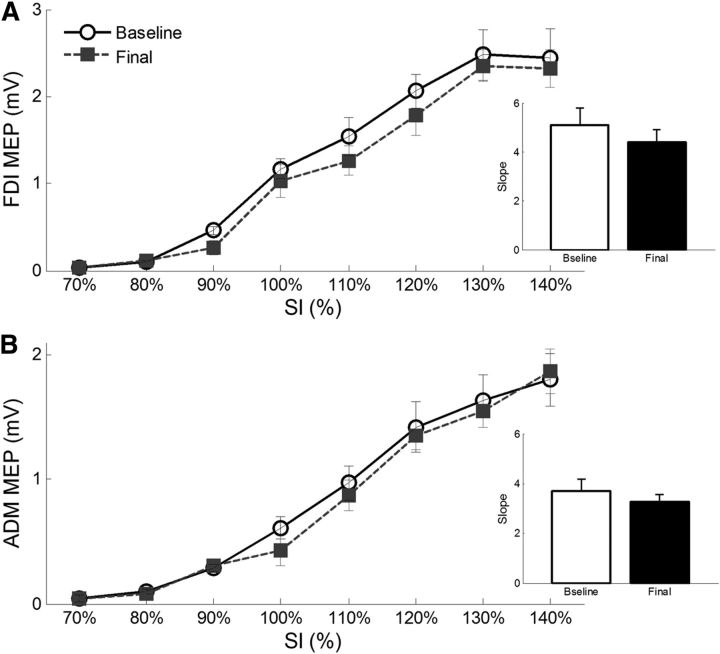
Figure 6.
Input–output curves of the FDI (A) and ADM (B) muscles measured in the expverbal group before and after the experimental procedure. Mean (±SE) MEP amplitude of the two muscles are represented for different intensities of stimulation (in percentage of SI). As shown, MEP amplitudes progressively increase with higher stimulus intensities, but no change has been found between the baseline and final sessions. Right small panels, Mean (±SE) slope values are represented for the FDI and ADM muscles in the baseline and final sessions. Again, no difference was found across sessions.

