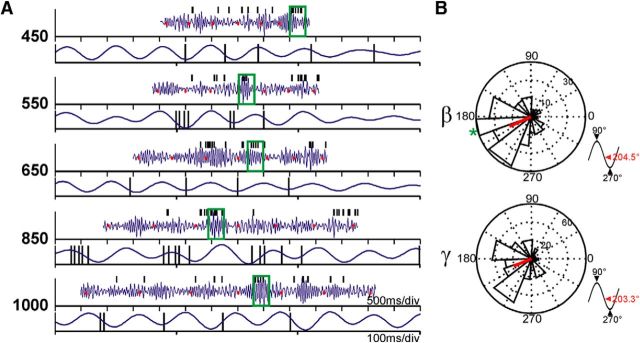
Figure 11.
Phase locking of unitary spikes with LFP oscillations. A, Representative β bandpass filtered and normalized LFP traces (blue) and the corresponding spikes from a single unit in the same recording site (black ticks). Tapping times are displayed as red dots. For each target interval, the top shows the LFP signal of a whole trial, where the segment enclosed within the green box is amplified in the bottom. B, Phase histograms showing the mean phases of all significantly phase-locked units to β or γ LFP activity. The red line indicates the mean resultant vector of the population. Bottom right insets, Location of the mean population phase in a standard sinusoid. The green asterisk in the β histogram indicates the phase of unit in A.

