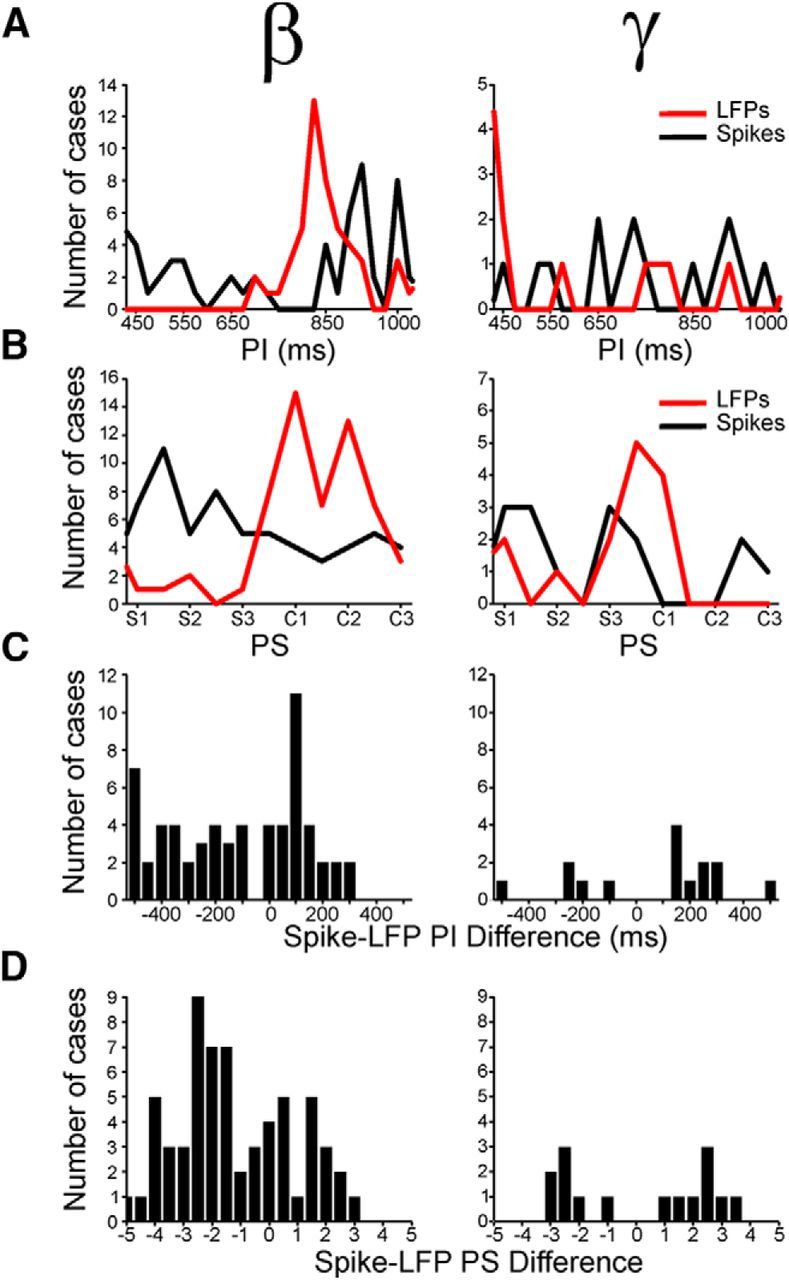
Figure 12.

Distributions of preferred intervals (PI) and preferred serial order (PS) for cells and LFPs simultaneously recorded in the same electrode. A, Distributions of PI for spiking activity (black line) and β (left) or γ (right) LFPs (red line) that were tuned to interval. B, Distributions of PS for spiking activity (black line) and β (left, red line) or γ-band oscillations (right, red line) that were tuned to serial order. C, Distributions of the difference in PI between spikes and LFPs for the β- (left) and γ-band (right). D, Distributions of the PS difference between spikes and LFPs for the β- (left) and γ-band (right).
