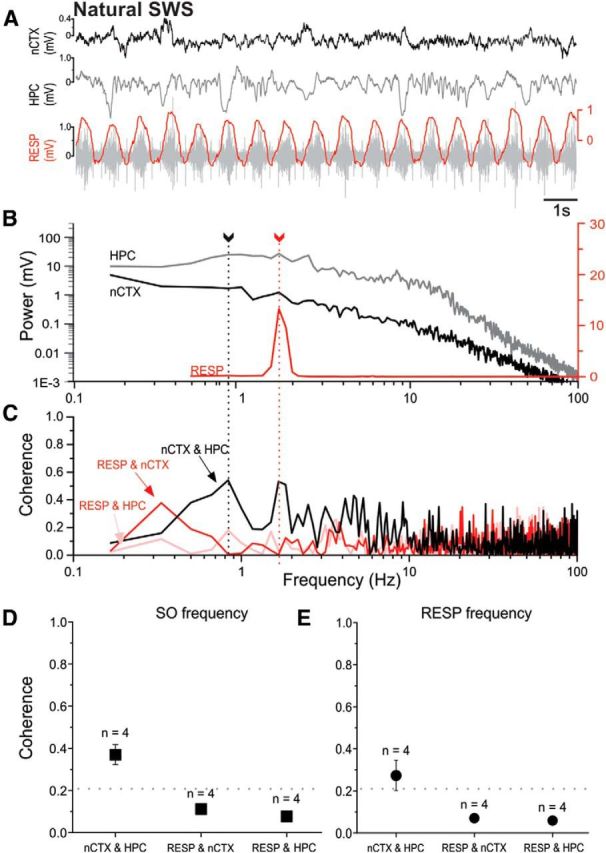
Figure 5.

Lack of frequency matching of neocortical/hippocampal and respiratory signals and lack of neocortical/hippocampal coupling to the respiratory cycle during natural sleep. A, Representative example of simultaneously recorded raw LFP traces from nCTX and HPC sites, together with EMG readings from intercostal implantations (RESP; gray). Overlaying the raw EMG is its RMS envelope (red). B, Overlaid power spectral plots from periods including those shown in A demonstrate different peak frequencies (fundamentals) when comparing brain-derived LFPs and the respiratory signal. Arrows with dotted lines indicate peak frequencies corresponding to cortical SO (black) and respiration (red) frequencies. The logarithmic scales for brain LFP power are shown on the left and the power of the respiratory signal is displayed on the linear scale to the right. Low-frequency, <0.5 Hz, near-DC-related activity was truncated from the respiratory plot for ease of visualization. C, Coherence spectra for all signal pairs illustrating high nCTX and HPC coupling across the SO bandwidth (and including the respiratory fundamental) but a lack of coupling of RESP with nCTX and HPC signals. Spectra shown (B,C) are from the same 1 min sample that includes the raw sample shown in A. D, Average coherence (±SEM) for signal pairs at the SO peak. Only the HPC and nCTX signals are significantly coherent, whereas respiration does not demonstrate coupling with the neocortical-hippocampal SO. E, Average coherence (±SEM) across experiments at the respiration peak frequency. As for the SO, only the HPC and nCTX signals were significantly coherent, whereas respiration does not demonstrate coupling with either brain site. For both D and E, the numbers of subjects for averages are displayed above the symbols. The horizontal dotted line indicates the threshold for significant coherence, >0.21.
