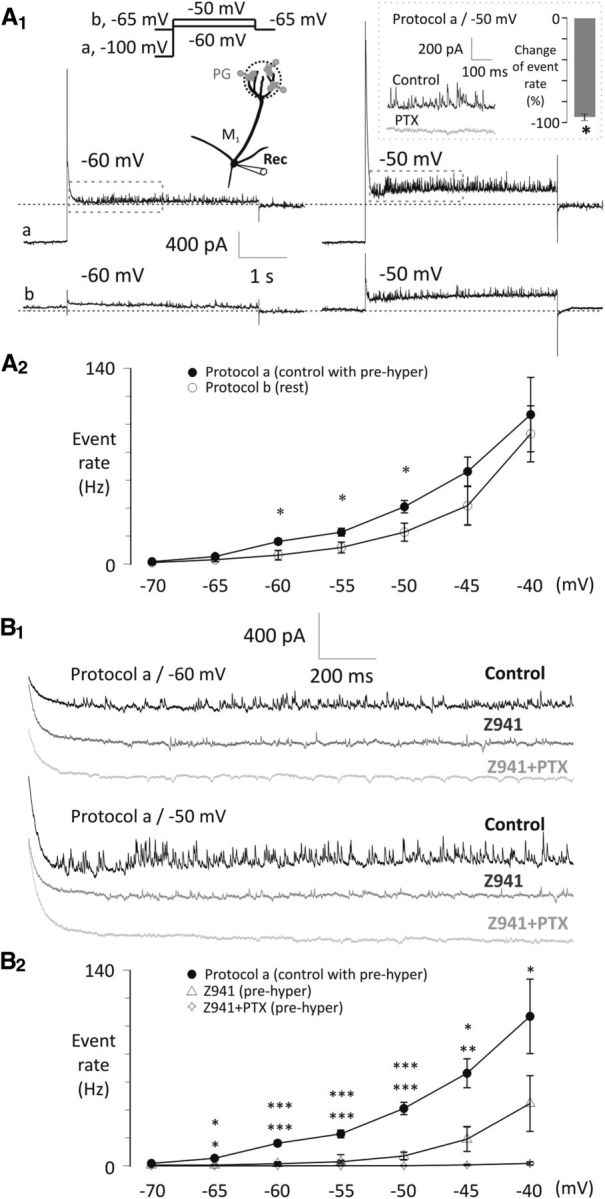
Figure 8.

Asynchronous IPSC frequency onto mitral cells is modulated by T-type Ca2+ channels and subthreshold potentials of mitral cells. A1, Example current traces show that voltage steps to −60 or −50 mV after either a 4 s hyperpolarizing prestep to −100 mV (Protocol a/control with prehyper) or keeping the mitral cell at −65 mV (Protocol b/rest, data are not leak subtracted) evoke asynchronous IPSCs onto mitral cells, with a rate dependent on the voltage of the prestep. Segments of control traces in the rectangles are magnified in B1. Inset, Inhibitory effect of bath-applied PTX (50 μm, n = 4) on asynchronous IPSCs at −50 mV test potential after applying Protocol a. *p < 0.05. A2, Summary diagram of the effects of Protocol a (control with prehyper, n = 6) or Protocol b (rest, n = 6) tested with voltage steps between −70 and −40 mV with 5 mV increments. Frequency of the IPSCs was calculated during a 1.5 s interval following the decay of the step-evoked A-current and was modulated by the prestep. *p < 0.05. B1, Example traces of the drug effect on the asynchronous IPSC frequency (control, black; Z941, 10 μm, middle gray; Z941 + PTX, 50 μm; light gray) at −60 and −50 mV test potentials after delivering Protocol a. B2, Summary diagram of the inhibitory drug effects (control, n = 6; Z941, n = 5; Z941 + PTX, n = 4) tested with voltage steps between −70 and −40 mV with 5 mV increments after applying Protocol a. QX-314 (0.5 mm) was included in the pipette throughout. Significance levels indicate comparisons of Protocol a versus Z941 (top row) and Protocol a versus Z941 + PTX (bottom row). *p < 0.05. **p < 0.01. ***p < 0.001.
