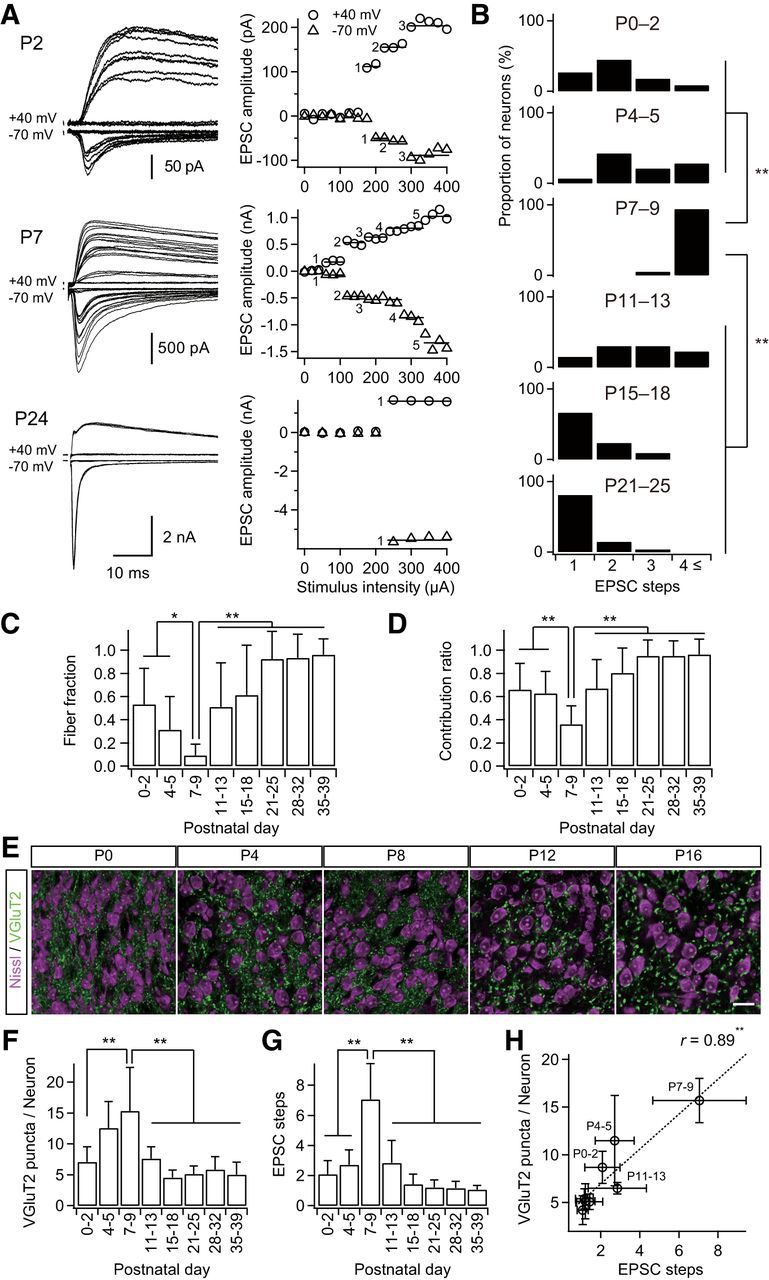
Figure 1.

Formation and elimination of lemniscal synapses during postnatal development. A, Developmental increase and decrease in number of innervating lemniscal fibers on a neuron in the whisker-related somatosensory thalamus. The number of innervating fibers was estimated by counting steps of lemniscal fiber-mediated EPSCs (lemniscal EPSCs) in response to increasing stimulus intensity applied to the lemniscal fiber bundle. Holding potentials were at +40 and −70 mV. Left, Several raw traces with different stimulus intensities are superimposed at each holding potential. Right, Search of EPSC steps. Peak amplitudes of lemniscal EPSCs are plotted against stimulus intensities. EPSC steps are indicated by horizontal bars and integers. B, Distributions of thalamic neurons with different numbers of lemniscal inputs throughout postnatal development. C, Developmental change in the fiber fraction, the first single fiber-meditated EPSC divided by the saturated currents of the same thalamic neuron. D, Developmental change in the contribution ratio, the ratio of the largest single-fiber-mediated EPSC to the saturated currents of the same thalamic neuron. E, Density of thalamic neurons decreased during the first postnatal week, whereas that of VGluT2 puncta decreased during the second but not first postnatal week in the V2 VPM. Scale bar, 20 μm. F, VGluT2 puncta per thalamic neuron within 1 μm optical slice first increased and then decreased during postnatal development. G, Electrophysiological evidence for the change in the number of lemniscal fiber inputs on a thalamic neuron. H, Correlation between VGluT2 puncta per neuron and EPSC steps, structural and functional data on synapse formation and elimination. r, Pearson's correlation coefficient. Broken line is the regression line. Values are represented as mean + SD. n = 13–42 thalamic neurons for each developmental bin for electrophysiological data; n = 12–40 images from 6–8 mice for each developmental bin for structural data. Statistical significance was tested by multiple t test with Bonferroni correction after one-way ANOVA for B, C, D, F, and G, and with the t test for noncorrelation for H. *p < 0.05; **p < 0.01; two-tailed test.
