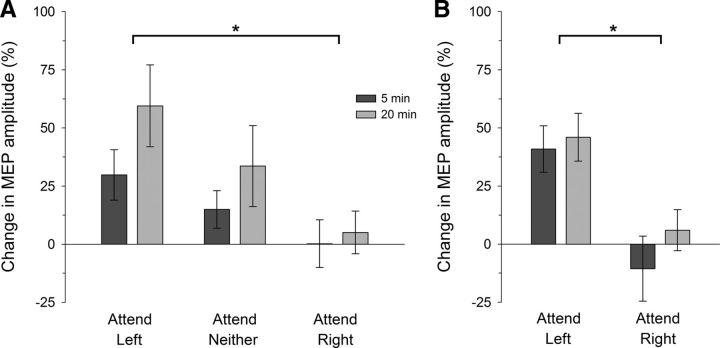
Figure 2.
PAS-induced LTP-like effects under different spatial attention conditions. Mean MEP amplitudes for the muscle targeted by PAS (left APB) are shown relative to the pre-PAS (baseline) level for the two post-PAS time intervals. After PAS, the increase in MEPs was significantly larger in the attend-left than the attend-right condition, both when the hands were visible (A, Experiment 1A) or hidden from view (B, Experiment 1B) during PAS: *p < 0.05. Error bars indicate within-subjects SEM (Cousineau, 2005). A, Legend applies to both panels.

