
Figure 2.
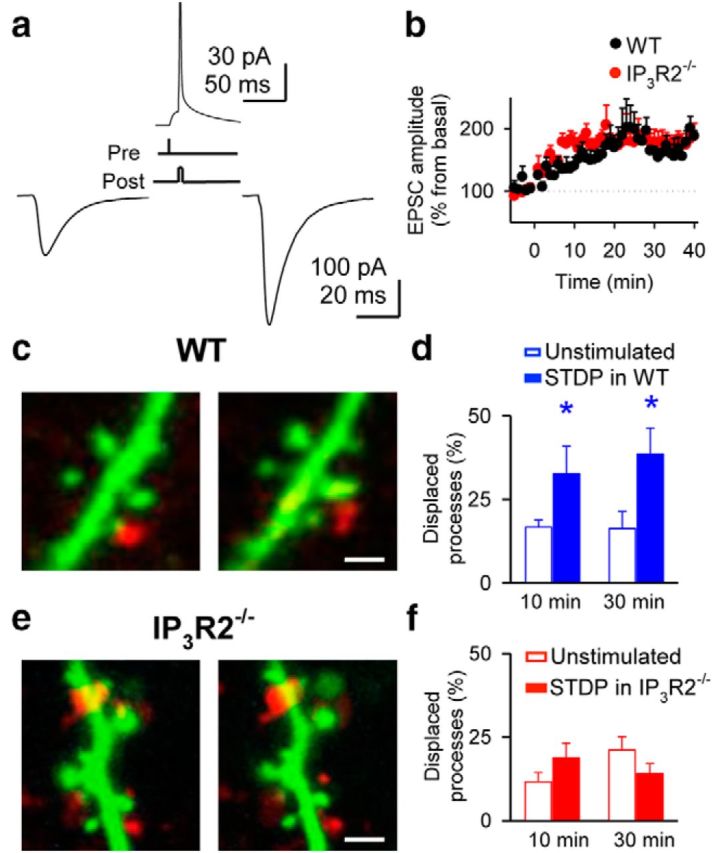
STDP correlates with astrocytic process remodeling. a, EPSCs before (left) and 30 min after (right) STDP protocol (top). b, Relative EPSC amplitudes in slices from wild-type (WT; n = 5) and IP3R2−/− (n = 6) mice. Zero time corresponds to the onset of the STDP protocol. c, Dendritic spines (green) and astrocytic processes (red) before (left) and 30 min after (right) delivering the STDP protocol in wild-type mice. Scale bar, 1 μm. d, Quantification of displaced processes in unstimulated (n = 6) and STDP-stimulated (n = 5) slices from wild-type mice. e, f, As in c, d, respectively, but in slices from IP3R2−/− mice. Scale bar, 2 μm. Significant differences were established at *p < 0.05.