
Figure 4.
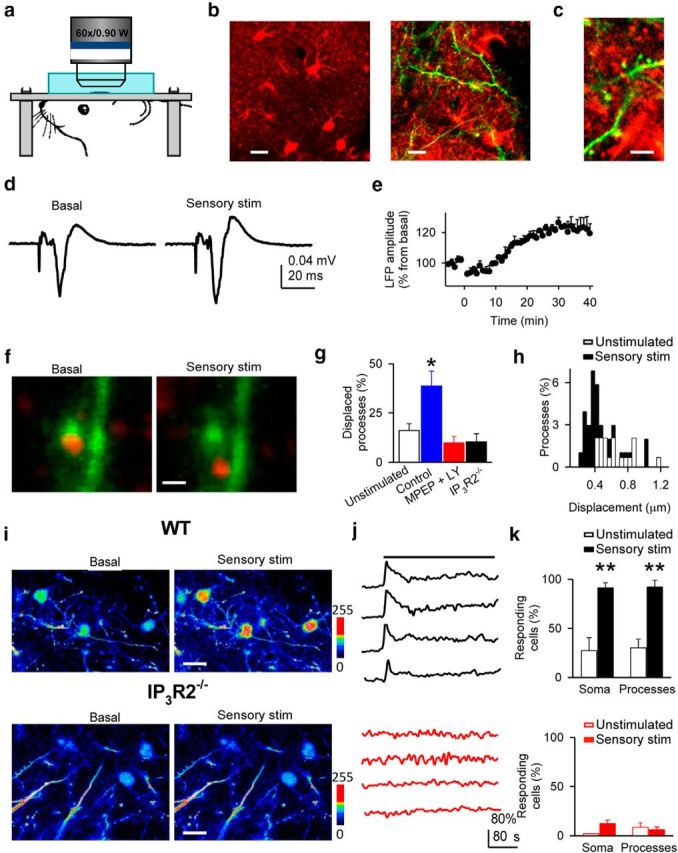
In vivo sensory stimulation correlates with astrocytic process remodeling in primary somatosensory cortex. a, Scheme of the in vivo imaging. b, c, Images at different magnification of in vivo astrocytes and processes stained with SR101 (red) and dendrites (green). Scale bars: b, left, 10 μm; right, 5 μm; c, 2 μm. d, LFP responses to whisker stimulation before and after sensory stimulation. e, Relative LFP responses (n = 5) before and after sensory stimulation at t = 0. f, Representative example of in vivo astrocytic process displacement after sensory stimulation. Scale bar, 1 μm. g, Displaced processes 30 min after sensory stimulation in unstimulated (n = 4), and stimulated in control (n = 4), MPEP + LY367385 (n = 8), and in the IP3R2−/− mice (n = 4). h, Displacement amplitude histograms (bin width: 0.05 μm) of in vivo astrocytic processes in unstimulated and sensory-stimulated mice (t = 30 min). i, In vivo images of Fluo-4-filled astrocytes before and after sensory stimulation from wild-type and IP3R2−/− mice. Scale bar, 10 μm. j, Ca2+ levels from four astrocytes from wild-type (black traces) and IP3R2−/− mice (red traces). Horizontal bar indicates sensory stimulation. k, Responding astrocytes from wild-type (top; 85 astrocytes, n = 4 mice) and IP3R2−/− mice (bottom; 67 astrocytes, n = 3 mice) in unstimulated and sensory stimulation conditions. Significant differences were established at *p < 0.05, **p < 0.01.