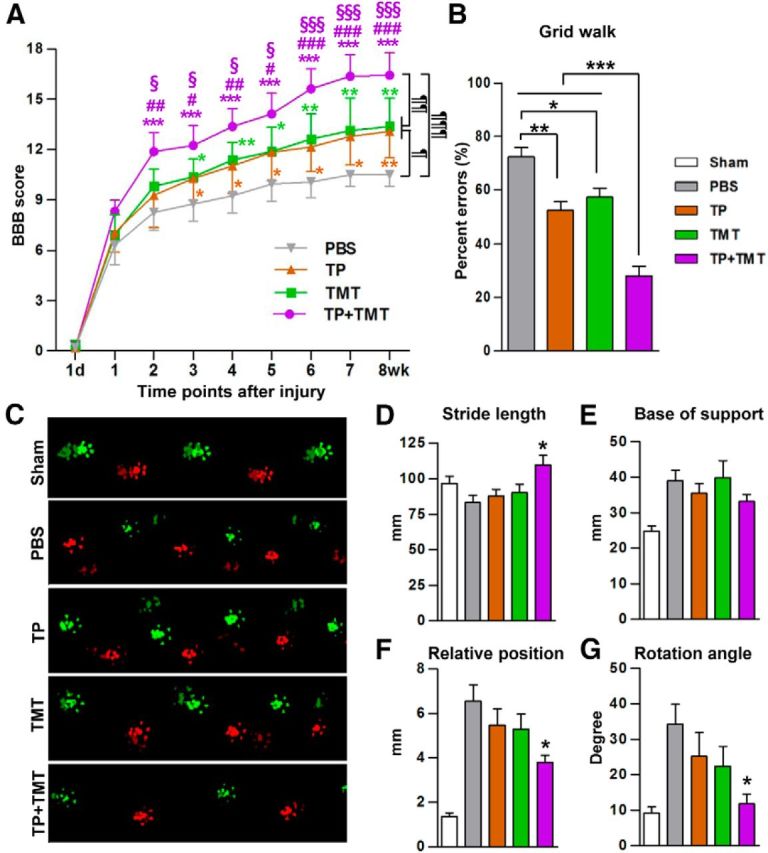
Figure 1.

Combining NSC transplantation and TMT enhanced locomotor recovery. A, Recovery of BBB locomotor scores over the 8-week period after injury. Animals with the combination of NSC TP and TMT (TP + TMT) showed significantly higher locomotor scores than those in either the TP-alone or TMT-alone group. ¶p < 0.05, ¶¶p < 0.01, and ¶¶¶p < 0.001 by repeated-measures two-way ANOVA followed by Tukey's post hoc comparison between different treatment groups. *p < 0.05, **p < 0.01, and ***p < 0.001 versus the PBS group; #p < 0.05, ##p < 0.01, and ###p < 0.001 versus the TP group; §p < 0.05 and §§§p < 0.001 versus TMT group by one-way ANOVA followed by Tukey's post hoc analysis at each time point. B, Grid walk test performed at 8 weeks after injury. The average number of hindpaw placement errors was divided by the total number steps taken per run to obtain the percent errors. Animals in the TP + TMT group showed the highest accuracy in the grid walk. **p < 0.01 and ***p < 0.001 by one-way ANOVA followed by Tukey's post hoc analysis. C, Representative footprints measured by the Catwalk system. Footprint colors were assigned by the system software (bright green = right forepaw, bright red = left forepaw, dim green = right hindpaw, and dim red = left hindpaw). D–G, Parameters indicating the quality of locomotion were assessed at 8 weeks after SCI. The graphs show stride length (distance between the two consecutive hindpaw footprints (D), base of support (width between the left and right hindpaws; E), relative position (distance between the center pads of forepaw and hindpaw prints; F), and rotation angle (angle of the hindpaw axis relative to the horizontal plane; G). *p < 0.05 compared with the PBS group by one-way ANOVA followed by Tukey's post hoc analysis. n = 8 animals per group (including the sham group in the Catwalk test) in all behavioral tests.
