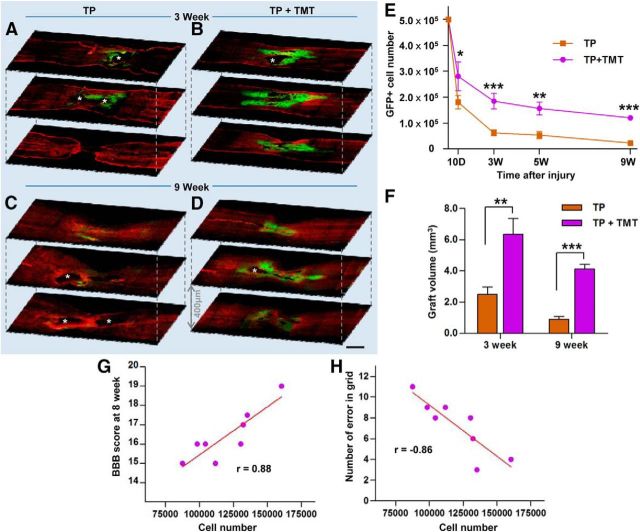
Figure 2.
Survival of transplanted NSCs in the injured spinal cord. A–D, Representative confocal microscopy images of injured spinal cord sections from the TP-alone (A, C) and TP + TMT groups (B, D) at 3 (A, B) or 9 weeks (C, D) after injury (2 or 8 weeks after TP, respectively). Spinal cord sections were immunostained with anti-GFP (green) and anti-glial fibrillary acidic protein (GFAP; red) antibodies to visualize the distribution of the grafted NSCs in relation to the lesions. Asterisks indicate lesion cavities. Scale bar, 1 mm. E, Stereological counts of grafted cells at each time point. n = 4, 8, 5, and 8 animals in each group at 10 d and 3, 5, and 9 weeks after injury (3 d and 2, 4, and 8 weeks, respectively, after TP). *p < 0.05, **p < 0.01, and ***p < 0.001 by one-way ANOVA followed by Tukey's post hoc analysis. F, Quantification of NSC graft volume at 3 and 9 weeks after injury (2 and 8 weeks after TP). **p < 0.01 and ***p < 0.001 by Student's t test. n = 8 animals per group. G, H, Number of surviving NSCs and the BBB locomotor scores (G) or the number of hindpaw placement errors in the grid walk (H) at the last trials (8 weeks after injury) were plotted for the 8 animals in the TP + TMT group. Each circle represents each animal. Correlation coefficient (r) was calculated using Pearson correlation analysis. The two variables were significantly correlated in both analyses (p < 0.01).

