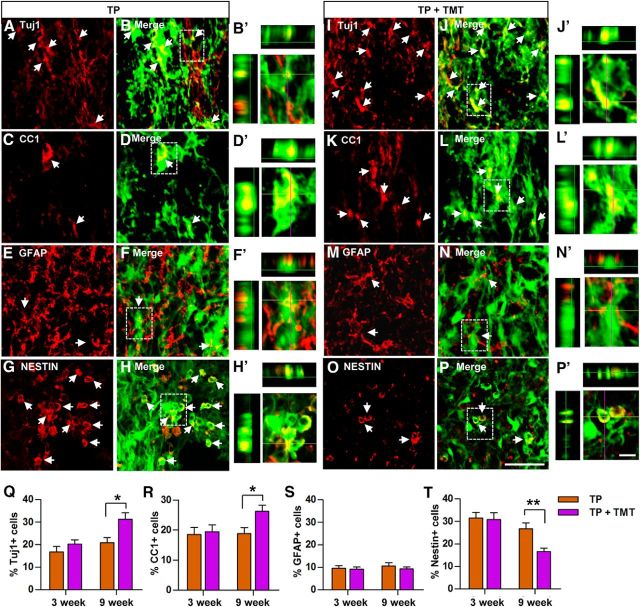
Figure 3.
Phenotypic differentiation of NSCs after transplantation into the injured spinal cord. A–P, Representative images of grafted NSCs in the spinal cord from animals in the TP-alone (A–H) or TP + TMT (I–P) group that were killed at either 3 or 9 weeks after injury. Neural cell phenotypes were determined by immunoreactivities (red) for the neuronal marker Tuj1 (A, I), the mature oligodendrocyte marker APC-CC1 (C, K), the astrocytic marker GFAP (E, M), and the undifferentiated NSC marker nestin (G, O). GFP-positive NSCs (green) colocalizing with neural cell markers are shown in yellow and are indicated by arrows (B, D,F, H, J, L, N, P). Scale bar, 50 μm. (B′, D′, F′, H′, J′, L′, N′,P′) Higher magnification and orthographic projection images of the boxed areas in B, D, F, H, J, L, N, and P, respectively. Scale bar, 10 μm. Q–T, Quantification of the percentage of NSCs that differentiated into neurons (Tuj1; Q), oligodendrocytes (CC1; R), or astrocytes (GFAP; S) or did not show into any specific neural cell type (nestin; T) at 3 and 9 weeks after injury. *p < 0.05 and **p < 0.01 by Student's t test. n = 8 per group.

