Figure 1.
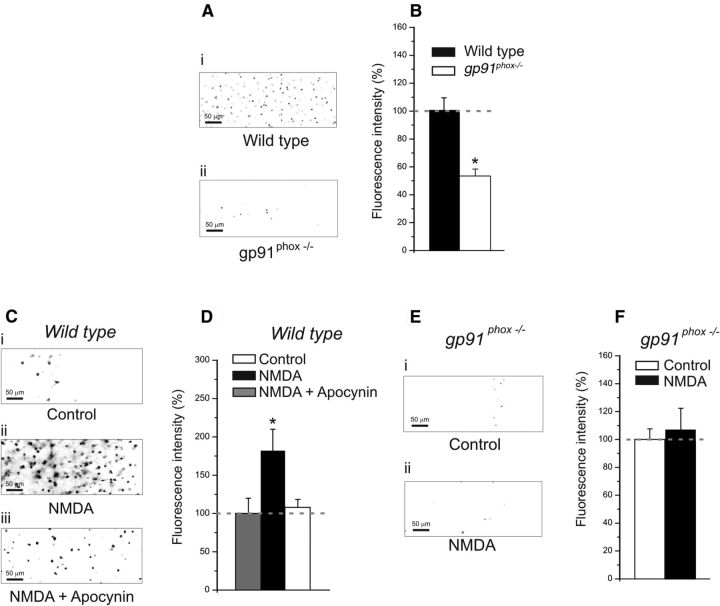
Pharmacological and genetic suppression of NOX2 results in lower levels of ROS production. A, Representative DHE digital images (grayscale-inverted colors) showing neuronal labeling in layer 2/3 of visual cortical slices obtained from wild-type (i) and gp91phox−/− experimental groups (ii). B, The graph represents fluorescence intensity evaluated by DHE staining in wild-type slices and gp91phox−/− animals. Slices derived from wild-type animals showed higher fluorescence intensity (wild-type: 13 slices, 4 animals; gp91phox−/−: 10 slices, 4 animals; p < 0.01 on a t test). Plotted data are average ± SEM. C, Representative DHE digital images (grayscale-inverted colors) showing neuronal labeling in slices from wild-type animals: treated with vehicle (i), treated with NMDA (ii), and treated with NMDA and apocynin. D, Results of NMDA application in slices obtained from wild-type animals. The graph shows the average values of DHE fluorescence in controls, in slices treated with NMDA, and in slices treated with NMDA and apocynin. Slices treated with NMDA showed higher fluorescence intensity than controls (NMDA: 7 slices, 4 animals; control: 7 slices, 4 animals; p < 0.05 on a one-way ANOVA with Newman–Keuls multiple-comparison test), whereas slices treated with NMDA and apocynin were not statistically different from controls (NMDA + apocynin: 7 slices, 4 animals; p > 0.1 on a one-way ANOVA with Newman–Keuls multiple-comparison test). Plotted data are average ± SEM. E, Examples of DHE fluorescence (grayscale-inverted colors) showing neuronal labeling in slices from gp91phox−/− animals: treated with vehicle (i), treated with NMDA (ii). F, Results of NMDA application in slices derived from gp91phox−/− animals. The graph shows the average values of DHE fluorescence in controls and in slices treated with NMDA. Slices treated with NMDA were not statistically different from controls (NMDA: 9 slices, 4 animals; control: 9 slices, 4 animals; p > 0.1 on a t test). Plotted data are average ± SEM.

