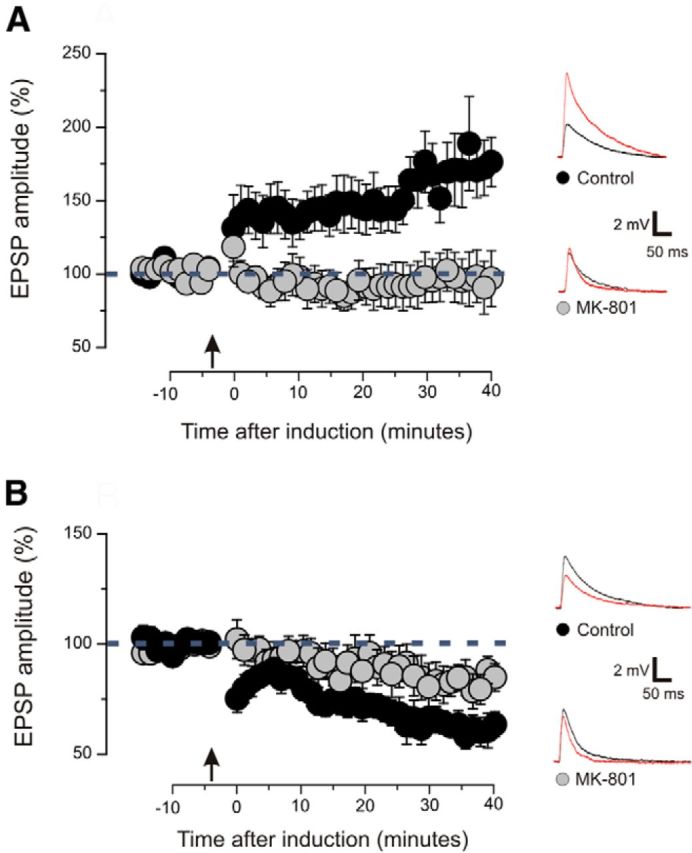
Figure 2.

LTP and LTD depend on the activation of NMDA receptors. A, Magnitude of EPSPs before and after the induction of LTP. Arrow indicates the time of induction. Slices treated with the NMDA receptor blocker MK-801 are compared with control slices treated with vehicle. In control slices, a significant LTP was induced (9 slices; 8 animals; p < 0.01 on a paired t test). In slices treated with MK-801, no significant change of postsynaptic response was found (8 slices; 7 animals; p > 0.1 on a paired t test). Examples of EPSP traces showed the amplitude before (black line) and after (red line) the induction. Plotted data are average ± SEM. B, Magnitude of EPSPs before and after the induction of LTD. Arrow indicates the time of induction. Slices treated with the NMDA receptor blocker MK-801 are compared with control slices treated with vehicle. A significant LTD was induced in control slices (9 slices; 7 animals; p < 0.001 on a paired t test) and in slices treated with MK-801 (8 slices; 7 animals; p < 0.05 on a paired t test). The LTD was significantly reduced in slices treated with MK-801 (p < 0.05 on t test). Examples of EPSP traces showed the amplitude before (black line) and after (redline) the induction. Plotted data are average ± SEM.
