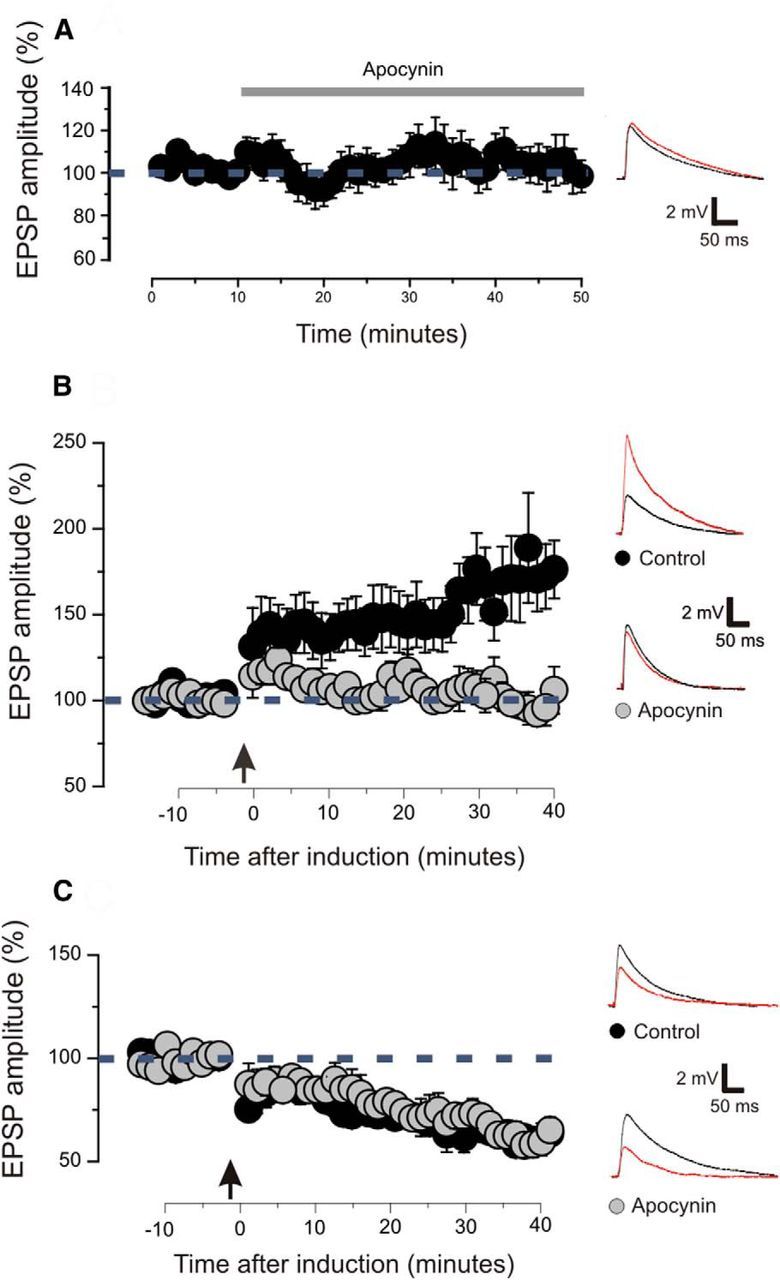
Figure 4.

LTP but not LTD is impaired by pharmacological inhibition of NOX2. A, Magnitude of EPSPs before and after the application of apocynin. Arrow indicates the time of induction. Examples of EPSP traces showed the amplitude before (black line) and after (red line) the drug application. Apocynin had no effect on the EPSPs (9 slices; 6 animals; p > 0.1 on a paired t test). Plotted data are average ± SEM. B, Magnitude of EPSPs before and after the induction of LTP. Arrow indicates the time of induction. Slices treated with apocynin are compared with control slices treated with vehicles. LTP was successfully induced in control slices (9 slices; 8 animals; p < 0.01 on a paired t test). Slices treated with apocynin showed no LTP (10 slices; 8 animals; p > 0.1 on a paired t test). Examples of EPSP traces showing the amplitude before (black line) and after (red line) the drug application. Plotted data are average ± SEM. C, Magnitude of excitatory postsynaptic responses before and after the induction of LTD. Arrow indicates the time of induction. Slices treated with apocynin are compared with control slices treated with vehicles. A significant LTD was obtained in control slices (9 slices; 7 animals; p < 0.001 on a paired t test) and in slices treated with apocynin (8 slices; 7 animals; p < 0.001 on a paired t test), and these values were not statistically different (p > 0.1 on a t test). Examples of EPSP traces showed the amplitude before (black line) and after (red line) the induction. Plotted data are average ± SEM.
