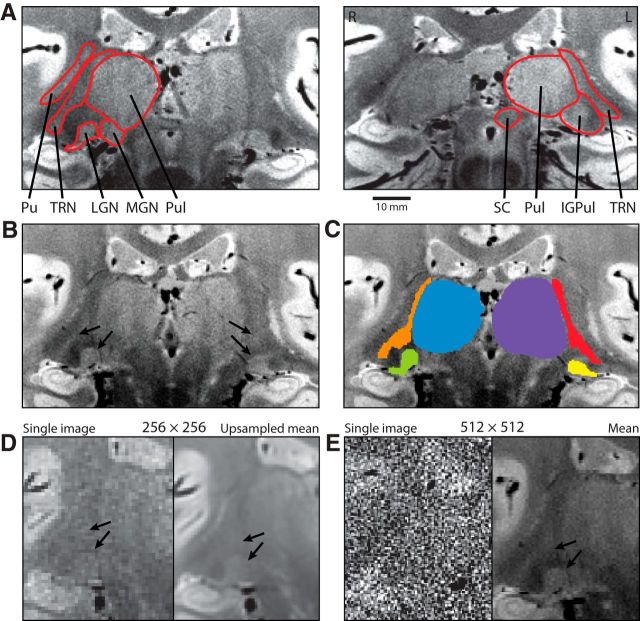
Figure 1.
High-resolution proton density images of the human thalamus. A, Left and right top, Regions of the thalamus in Subject S1 are labeled in two individual slices. The putamen (Pu), TRN, LGN, MGN, pulvinar (Pul), superior colliculus (SC), and intergeniculate pulvinar (IGPul) are shown. The right (R) and left (L) sides of the images are labeled. Scale bar, 10 mm. B, Image with arrows pointing to the TRN and LGN. C, Labeled TRN, LGN, and pulvinar regions from the same slice as in B. D, E, Both single images and the mean of multiple images. D, Images were acquired with a 256 × 256 matrix, with the mean image upsampled to twice the resolution in each dimension. E, Images were acquired with a 512 × 512 matrix. Arrows indicate the LGN and TRN.

