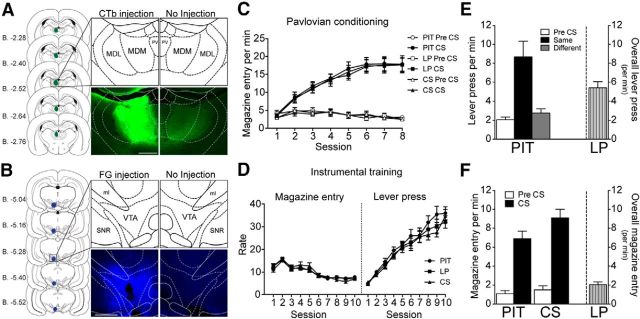
Figure 1.
Experiment 1. A, B, Schematic representation of the spread of the tracer and a photomicrograph of the injection site in one hemisphere compared with the noninjected hemisphere of CTb and FG injected into the MD and ventral tegmental area, respectively (Paxinos and Watson, 2007). C, D, Pavlovian and instrumental training presented as the rate of magazine entries per minute during the Pre-CS and CS periods and magazine entries and lever presses per minute, respectively, over sessions in Groups PIT (n = 9), LP (n = 10), and CS (n = 10). E, F, Performance during behavioral test conditions. E, Left, Lever pressing performance of Group PIT shown as lever pressing per minute during the Pre-CS period (Pre-CS) and separately during the CS period, for responding on the lever that, in training, delivered the same outcome as that predicted by the CS (Same) and on the lever that had delivered the different outcome (Different). Right, Performance of Group LP shown as lever presses per minute throughout the entire session. F, Left, Magazine entries per minute of Groups PIT and CS separated into Pre-CS and CS periods. Right, Magazine entries per minute for Group LP throughout the entire session. PV, Paraventricular thalamic nucleus; MDM, mediodorsal thalamus nucleus, medial part; MDL, mediodorsal thalamus nucleus, lateral part. Scale bar, 500 μm.

